So far, for our solar assignment, James, Brent and I have focused on getting the basic functionality of our hardware down. We have been building a solar (plant) rover, a friendly light-seeking bot that tries to use its energy particularly judiciously.
We knew we wanted to give it the ability to control motors and a few light sensors, at the least. To that end, we began measure the current draw from different motors we had on hand. We had a plain DC motor and a geared motor to work with. We found that our plain DC motor draw 400 mA at 3V, but the geared DC motor performed better in both loaded and unloaded conditions:
- 0.06 mA, unloaded geared-DC motor @ 3V
- 90 mA, unloaded geared-DC motor @ 6V
- 300 mA, fully loaded geared-DC motor @ 3.6V
Because we intended to use two such wheels in our project, essentially our current needs would be 600 mA, which with a fully charged 500 mAh batter, would last us a bit less than an hour.
We did have a few tricks up our sleeves to make our rover more efficient.
In our initial designs, we imagined our solar plant rover as traveling across the floor of a sunny room throughout the day, seeking “lighter” ground from time to time. In order to accomplish this, we don’t really need the rover to be constantly active, but rather, adjust to new lighting conditions from time to time.
James and I had both been in Eric Rosenthal’s Basic Analog Circuits and had used a 555 timer chip in one of the labs – it seemed as though it would be a good fit for our needs (and possibly a more interesting alternative to existing deep sleep libraries).
After researching and testing a few different 555 configurations, we settled on an astable multivibrator mode (using this site as a key resource: link). We intended to use the timer chip to power on our arduino + sensor + actuator setup for about 3 mins and then power off for an hour or more.
We used the RC Time Constant calculate our capacitor and resistor needs. Our calculations were a bit different from the usual equation, because we were using a set of diodes to isolate the effect of one of the resistors, so that we could have a longer off-period in our duty cycle without affecting our 3 minute mark.
For our current timing circuit, we are using resistors that are nominally marked as 500k and 20k and see a 1.5 hour off period and a 3 minute on period.
We tested the current draw of our whole system and found that it draw about 2 mA in the off state and 300-350 mA when the motors were at work, loaded.
In order to run these measurements, we came across a set of interesting discoveries.
-
The human body is about 200-300k ohms. More accurately, my human body. I had taken my multimeter to our bins of resistors in the shop to ensure I was getting the values I thought I was (the bins are a mess), and it seemed that all of the higher-value resistors were reading about 300k ohms. I had become the path of least resistance! Once I had James hold the other end of the resistor to the multimeter, this problem was resolved.
-
The 555 timer, in order to output steady amperage seems to require resistors of a high-enough value. In order to measure the current draw of our system, we had switched out our timing resistors to make our duty cycle shorter. Unfortunately, at lower resistor values (< 500 ohms on one, about 3.3k ohms on the other), the Arduino’s power LED would flicker and show evidence of less than steady amperage. Once we switched the 10k resistors, the problem seemed to resolve.
This post has glazed over the parts that I did not focus on. Brent has worked to engineer the robot behavior by coding its response to different lighting conditions. We are using 4 LDRs, placed in cardinal directions, and have applied an Kalman filter (James’s suggestion!) to smooth the data we receive from their associated analogRead pins on our Arduino. Brent has been working with the robot to make it turn in the direction of the most well-lit LDR.
Next, we have to finalize the form of our rover. It’s current form is not particularly friendly to the transport of plants, so a bit of fabrication is in order.
I got a wee bit lost on this assignment and jumped around from the many possible ways to satisfy its requirements. I initially started by modifying the ‘marc_template’ from Jer’s github to traverse through other sets of keywords. I played around with examining flowers and electrical appliances in the visual materials. One thing I immediately realized was that I was not familiar with MARC records well enough to traverse it as freely as I would have liked. I found this link in Jer’s code comments: https://folgerpedia.folger.edu/Interpreting_MARC_records#2xx, but nonetheless found it was necessary to do quite a bit of digging to pull fields that Jer hadn’t already pre-populated into his parser.
I then tried to play around with Jer’s network graph based on the name authority records. Again, ran into similar issues with MARC documentation – I eventually found a side that documented how to pull gender information from MARC records, but then promptly misplaced the site amongst my many tabs.
I decided to change tacks slightly by pursuing modifications on Jer’s network graph Glitch, but found Sigma.js’s documentation to be somewhat lacking. I decided my contribution for this week would be to clean up the json that Jer had used in his occupation graph. For this, I used a bit of python that I ran right from my Terminal. Code as follows:
import json

data = { "nodes": [ ... ] } # I copy/pasted Jer's JSON into this variable
data_list = data["nodes"]

filtered_data = [node for node in data_list if node['label']]
with open('cleaned_occupations.json', 'w') as outfile:\
	json.dump(filtered_data, outfile
After a few minor edits to that output, (I added back in the { "nodes": and trailing }), I uploaded that to a gist on github, and adjusted Glitch network graph (forked from Jer, with a few styling adjustments).
It does not really look very different from what we had last week, but the data is cleaner. If you insist on seeing it: https://glitch.com/edit/#!/tender-pony?path=views/index.html:32:17
I tried to through this into Mike Bostock’s force-directed, but realized my data was structured differently than his (no explicit links in my set). A mess nonetheless: https://observablehq.com/d/1403340886c072e5
2. Use the farm database on InfluxDB. Write queries to answer the following questions:
- When did the outside sensor break and stop sending data?
select * from /.*/ where location = 'outside' ORDER BY time DESC limit 1

- What was the lowest temperature recorded in 2018? Which sensor recorded this data?
SELECT min(value), location from temperature where time >= '2018-01-01' and time < '2018-12-31' tz('America/New_York')

3. Find the min and max temperatures by week for the root cellar for the last 3 months of 2018.
- Use InfluxDB and the farm database. Hint: use group by time(interval)
SELECT min(value), max(value) from temperature where time >= '2018-10-01' and time < '2018-12-31' and location ='rootcellar' group by time(1w)tz('America/New_York')

- Use TimescaleDB and the tsfarm database. Hint: use the time_bucket function
SELECT time_bucket('1 week', recorded_at::timestamp) AS one_week,
        min(reading), max(reading)
    FROM sensor_data
    WHERE recorded_at BETWEEN '2018-10-01' and '2018-12-31'
    AND device = 'rootcellar'
    AND measurement = 'temperature'
    GROUP BY one_week;

Explain the differences between the InfluxDB and TimescaleDB and query results.
InfluxDB and TimescaleDB has differing defaults for their weekly intervals. For example, in InfluxDB, the default start of the week is Monday (you can see the dates for the weekly results begins 9/27 rather than 10/1). This results differences in each of their reported min and max values.
Challenge: Run the same query in MongoDB using the farm database
db.sensorData.aggregate([{
$match: { "measurement": "temperature", "device": "rootcellar", "recorded": {
             $gte: new ISODate("2018-10-01T00:00:00-05:00"),
             $lte: new ISODate("2018-12-31T00:00:00-05:00")
         }
     }
 }, {
     $group: {
			_id: {
             week: {
                 $week: {
                     date: "$recorded",
                     timezone: "America/New_York"
                 }
             }
         },
         min: { $min: "$reading" },
         max: { $max: "$reading" },
     }
 }])

Write two queries that use data from your sensor data from InfluxDB.
A fun way to discover that my sensor had disconnected from my WiFi network:
select * from light where device = 'device_rk' order by time DESC limit 10

I also checked out the min and max temperatures from my sensor. The readings seemed a little high to me, though qualitatively, the living room is the warmest part of my apartment (and that is where my sensor is presently located).

I had a few types of batteries around, specs below:
- 3.7 V, 500 mAh lithium ion polymer Battery
- 1.85 watt hours, 6660 joules
- 1.5 V, 2700mAh AA alkaline battery
- 4.05 watt hours, 14580 joules
- 3 V, 235mAh lithium coin cell battery
- 0.705 watt hours, 2538 joules
The calculations were computed with the help of the Google search bar.
I made a minimal change in my code from the last assignment so that it would send data to the class server every 2 minutes, rather than every 10 seconds. I kept this interval consistent for light, humidity, and temperature because I’m collecting data from my living room, which stays pretty consistent across those variables over time.
For the SQL related queries of this assignment, we had to answer the following questions by querying Don’s postgres database (questions & answers below):
1. When did the outside sensor break and stop sending data?
SELECT measurement, recorded_at FROM sensor_data
WHERE device='outside'
ORDER BY 2 DESC LIMIT 5;

2. Show the min and max temperature in the root cellar by year.
SELECT EXTRACT(YEAR FROM recorded_at) as year, min(reading), max(reading) FROM sensor_data
WHERE measurement = 'temperature' AND device='rootcellar'
GROUP BY 1;

3. What was the lowest temperature recorded 2018?
SELECT EXTRACT(YEAR FROM recorded_at) as year, min(reading) FROM sensor_data
WHERE measurement = 'temperature' AND EXTRACT(year FROM recorded_at) = '2018'
GROUP BY 1;

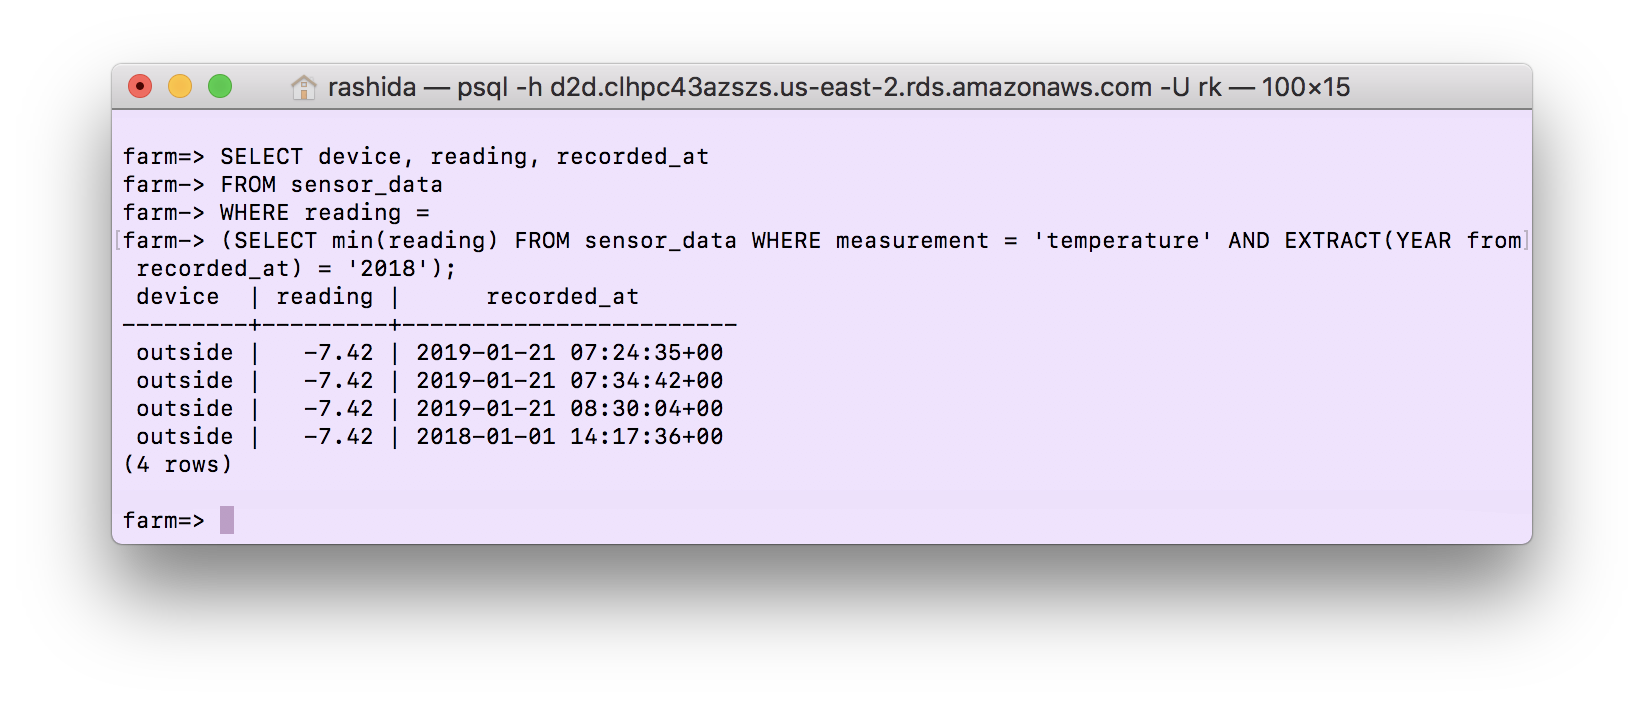
Challenge: Which sensor recorded the lowest temperature 2018 and when? Hint: you need a subquery.
SELECT device, reading, recorded_at
FROM sensor data
WHERE reading =
	(SELECT min(reading) FROM sensor_data
		WHERE measurement = 'temperature' AND EXTRACT(year FROM recorded_at) = '2018');

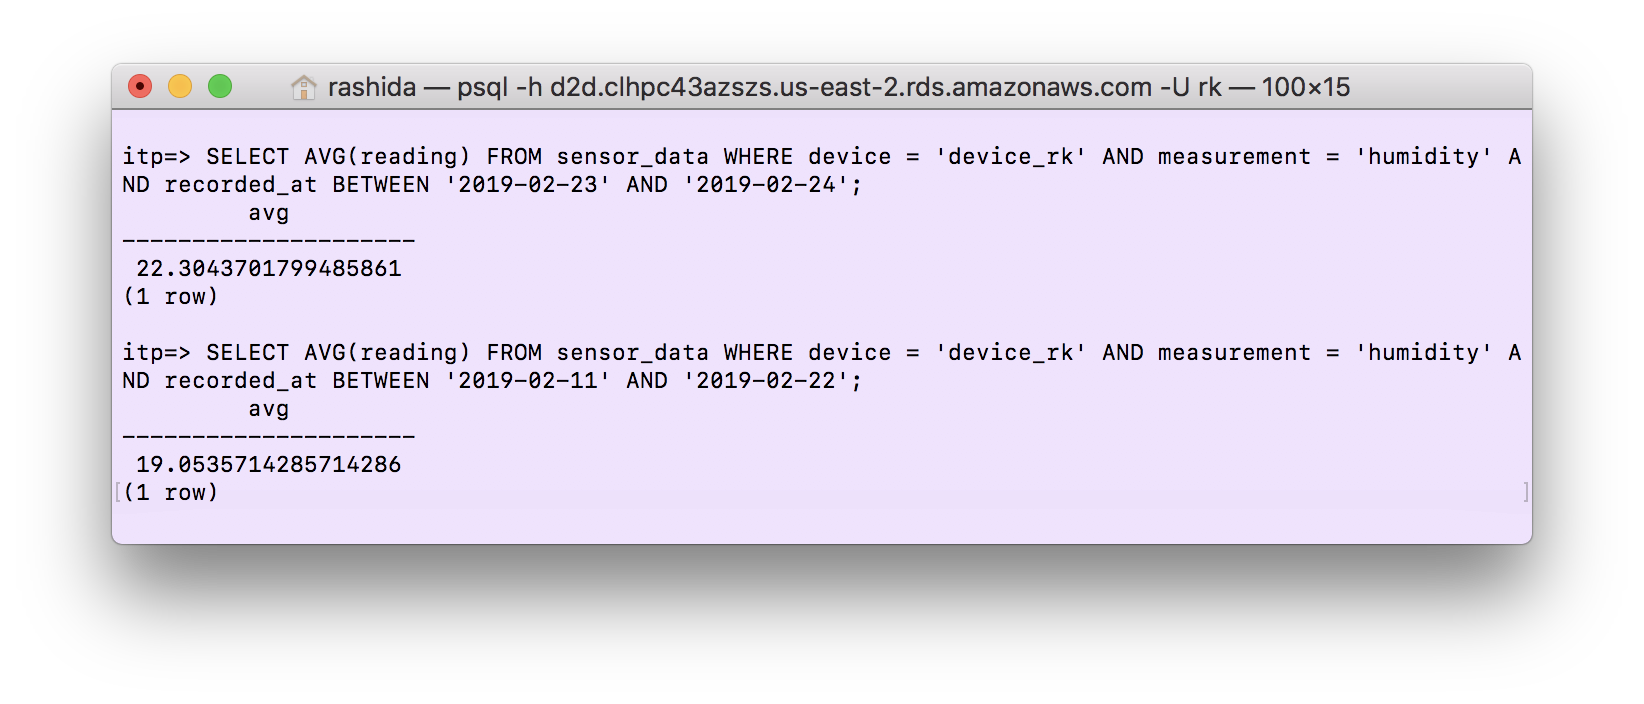
For Part 3, we had to write queries that used data from our own sensors. I tend to complain that the air in my apartment is way too dry, and I suspected that the humidity at home would be less than that of ITP.
SELECT AVG(reading) FROM sensor_data
WHERE device = 'device_rk' AND measurement = 'humidity' AND recorded_at BETWEEN '2019-02-23' AND '2019-02-24';
SELECT AVG(reading) FROM sensor_data
WHERE device = 'device_rk' AND measurement = 'humidity' AND recorded_at BETWEEN '2019-02-11' AND '2019-02-22';

Goes to show what I know! The first query seen above is solely measurements taken from my apartment (whereas the second set is from school), and it seems that my apartment is marginally more humid than school. I haven’t checked out the error specs of the temperature/humidity sensor we are using, but concievably this difference is within the error rate of the sensor, and the comparison is meaningless.


