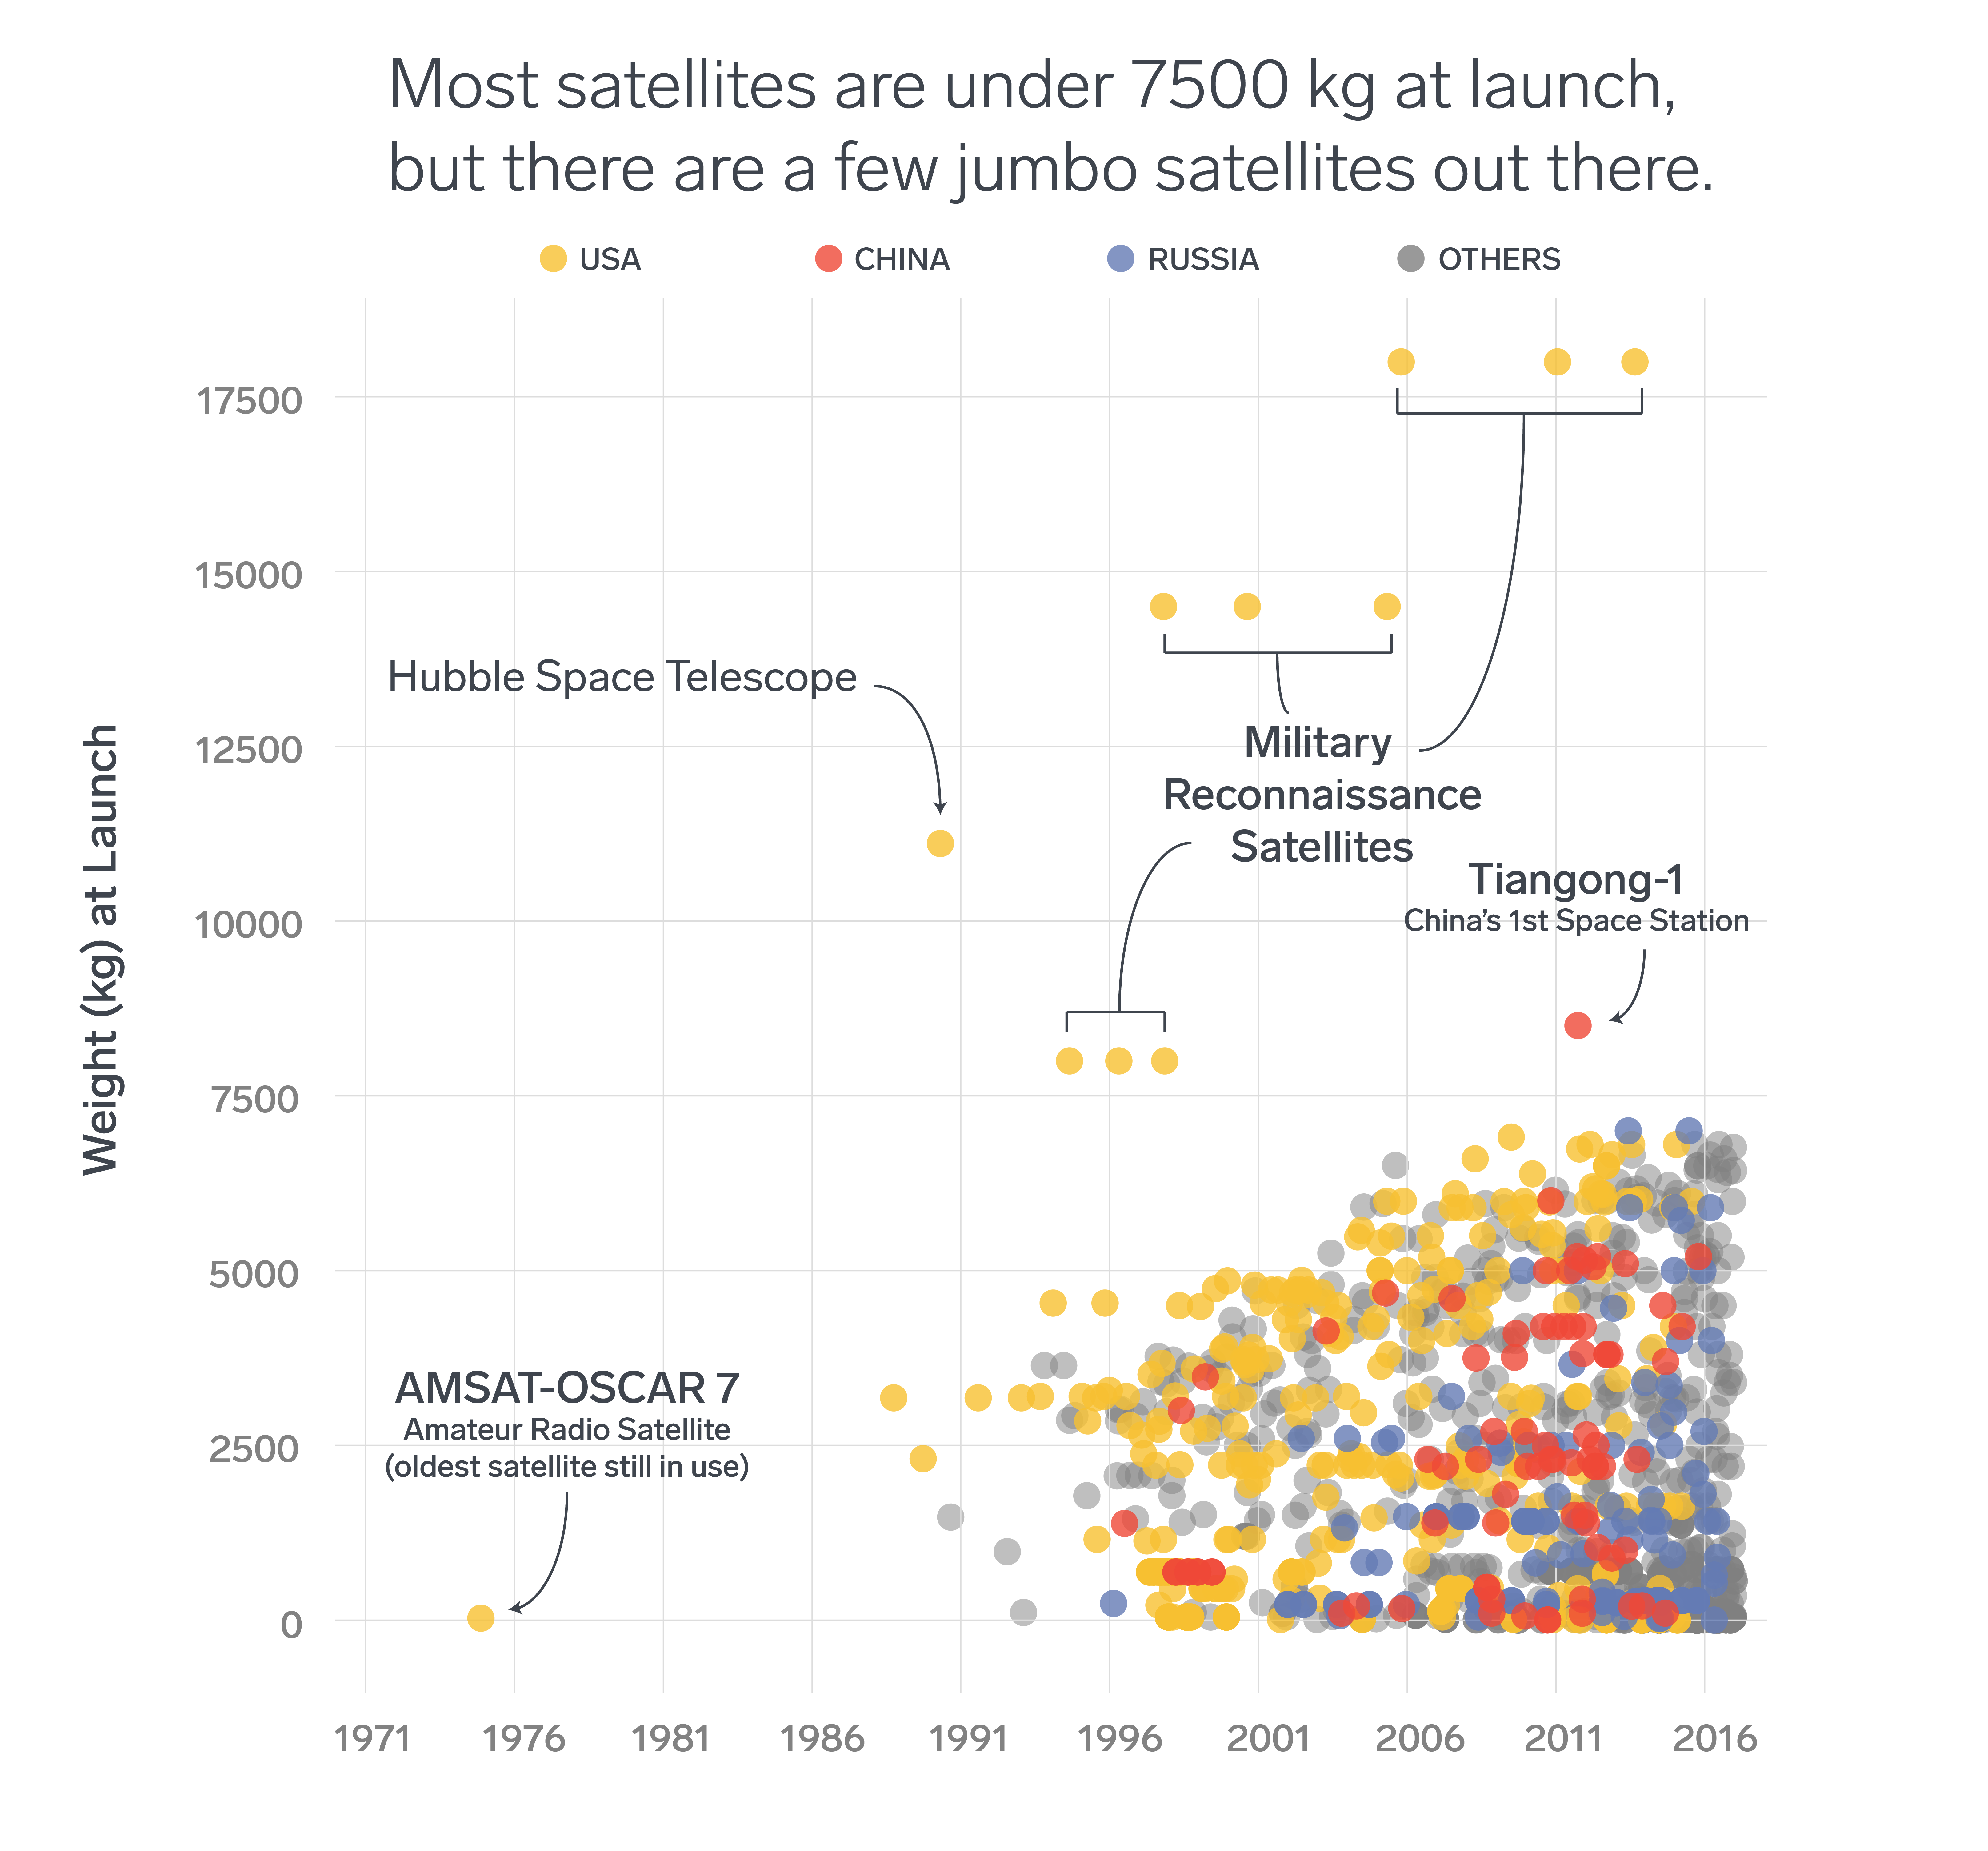
Rashida Kamal
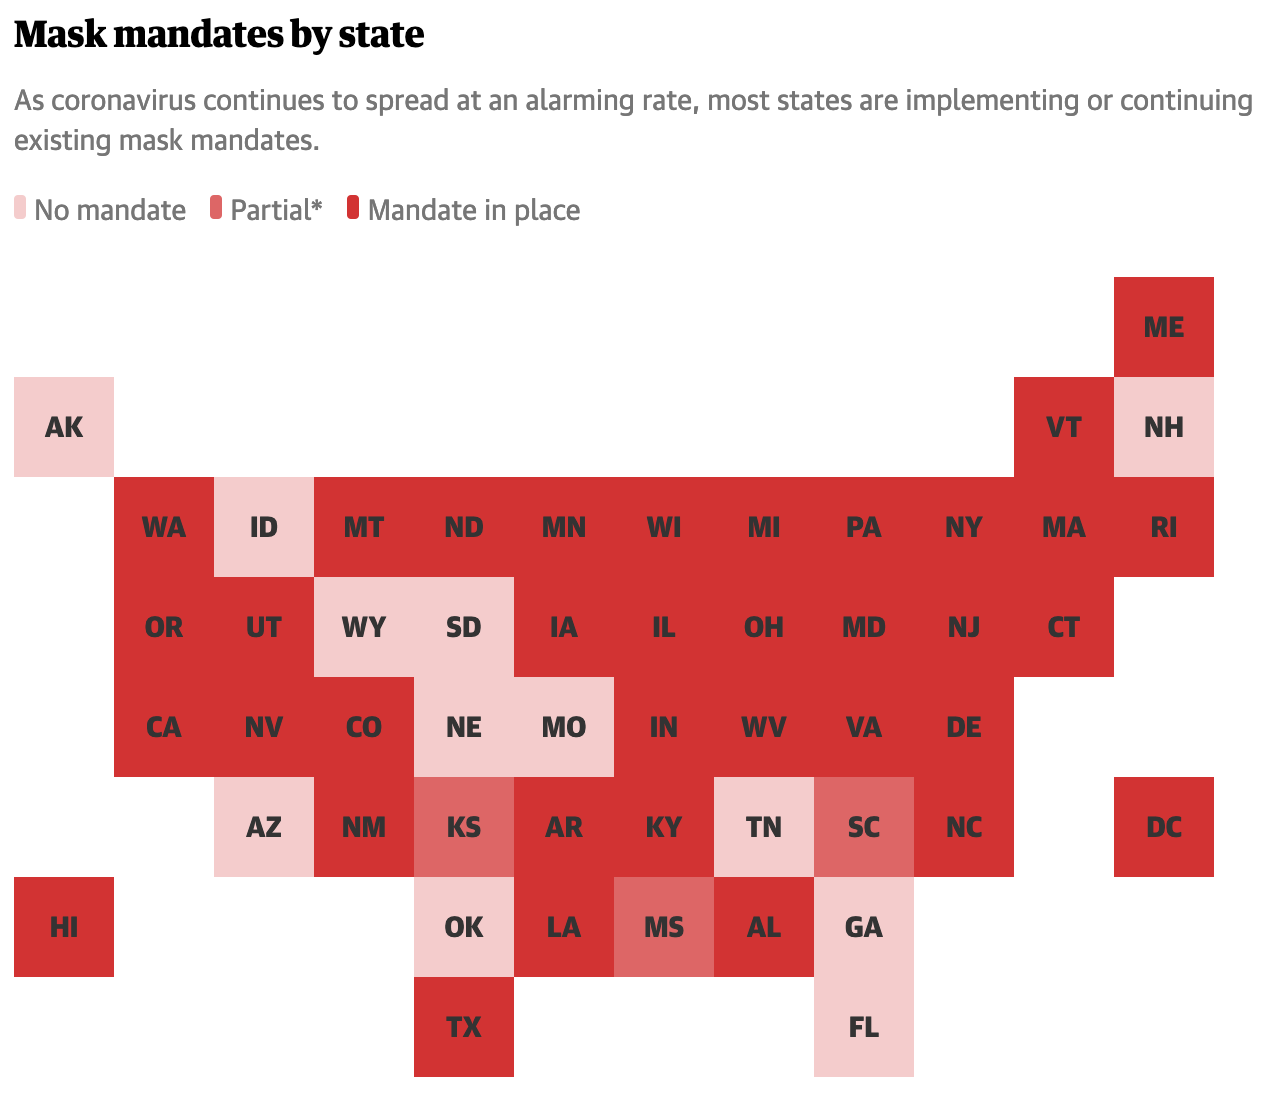
Data & Visuals at The Guardian US
A set of visualizations I've worked on as a data journalist at The Guardian US.
↳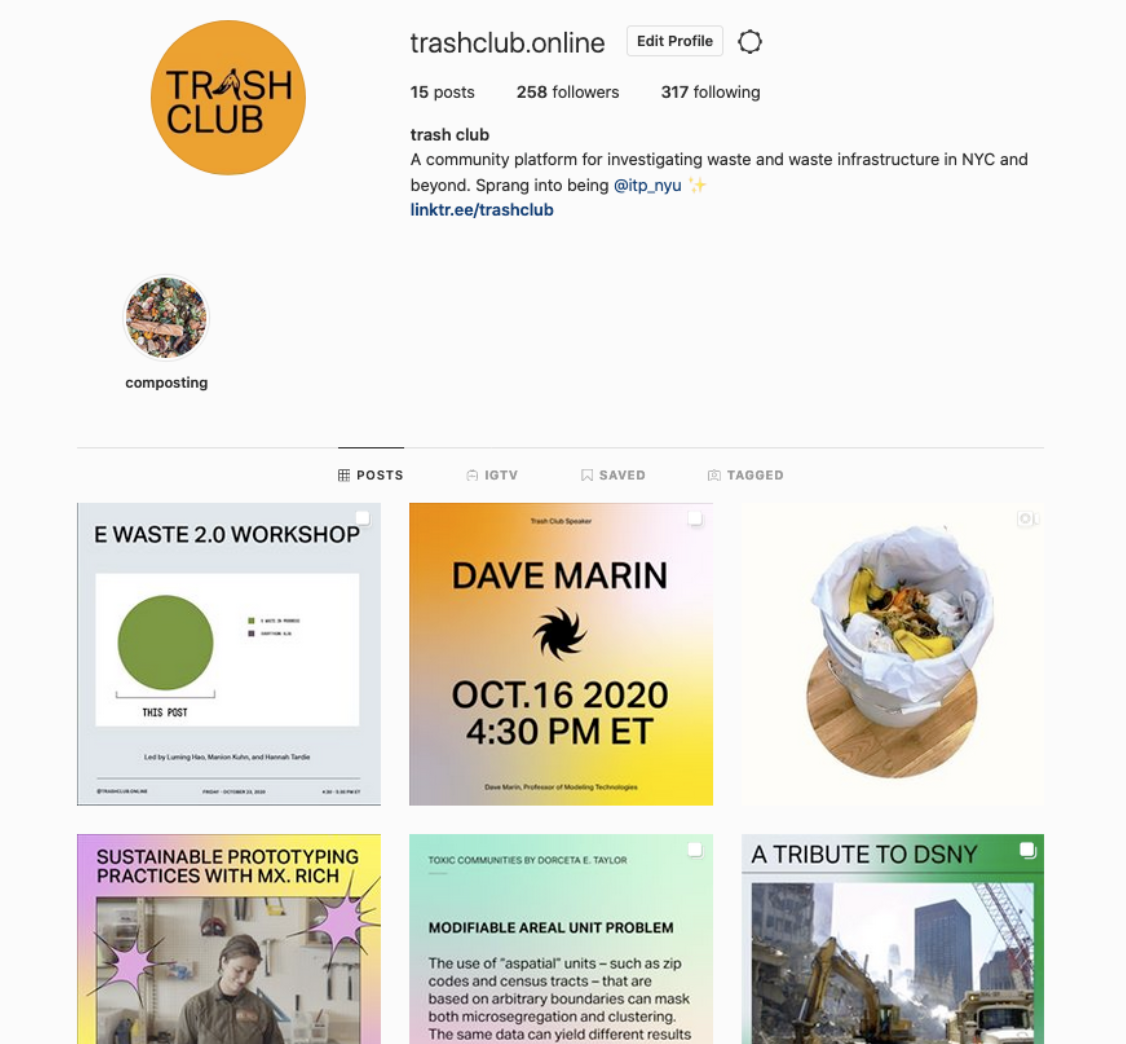
Trash Club
Trash Club is a community platform for the ongoing investigation and collective engagement with waste management in New York City and beyond.
↳
Enigma: Newsletter Graphics
A number of static graphics created for the Enigma "Between Two Rows" monthly newsletter.
↳
Enigma: Reports & Blogs
A number of analyses and visualizations created for Enigma's blog and internal reports.
↳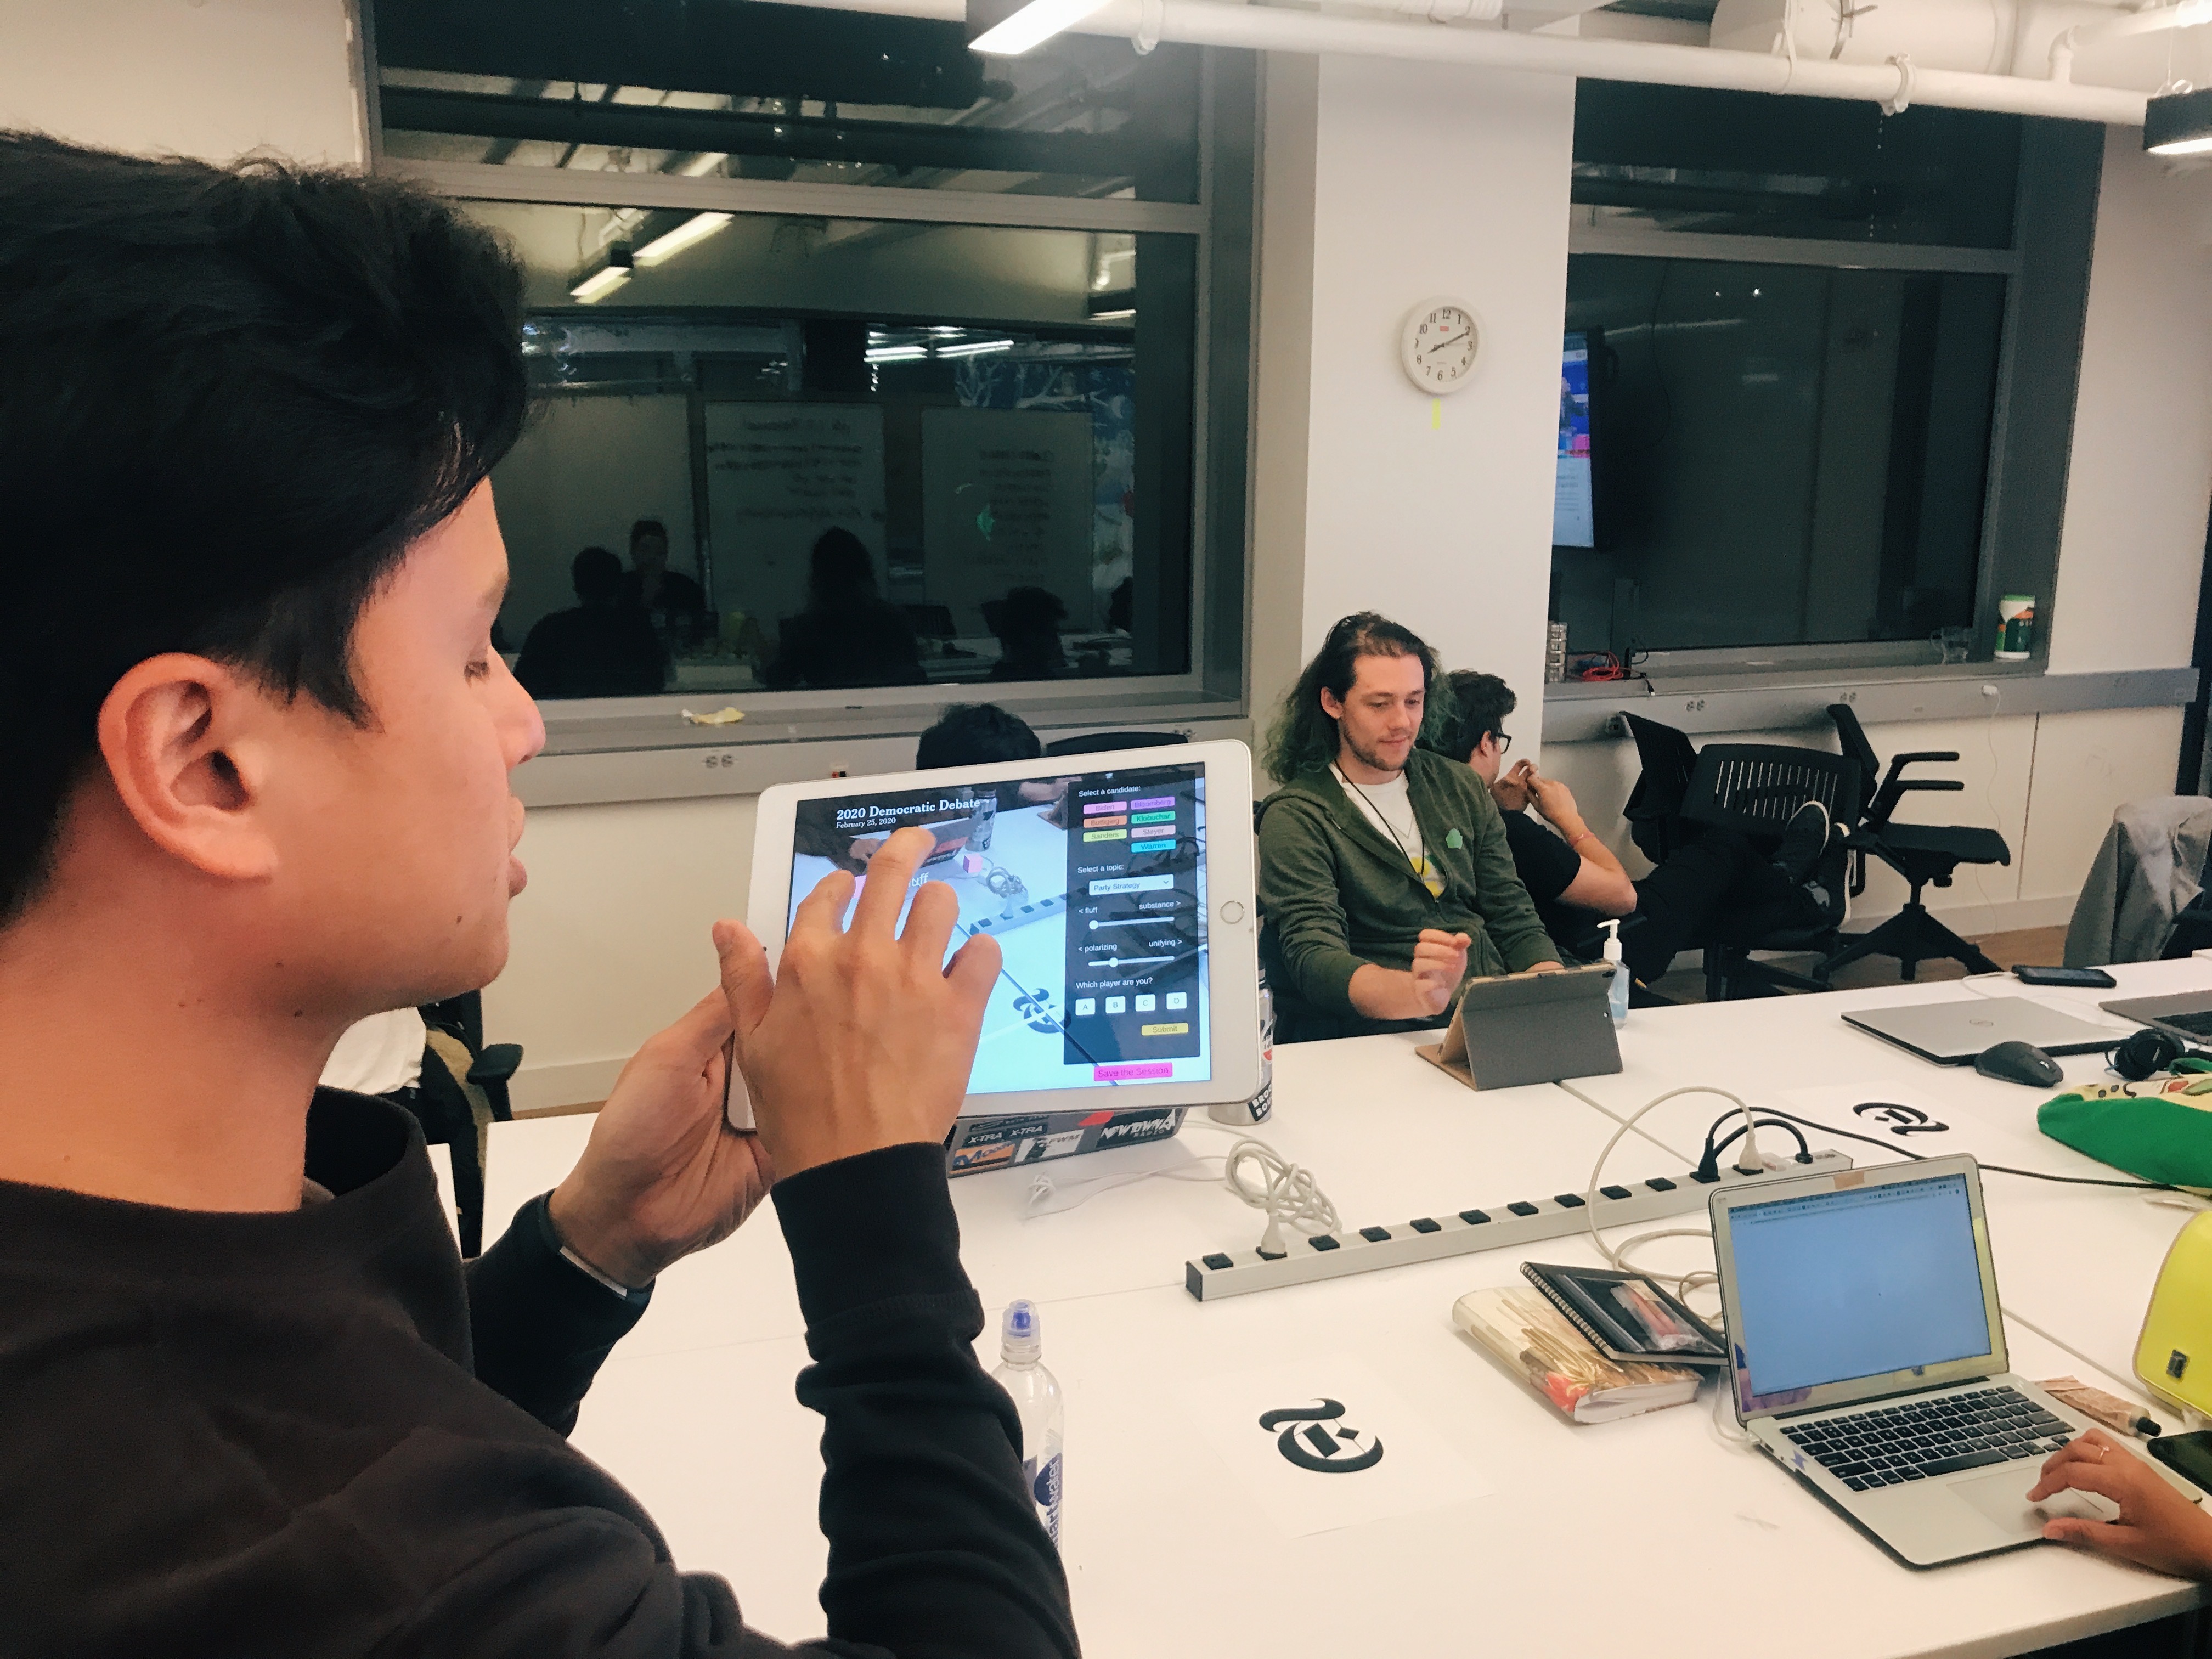
Tabletop Live: NYTimes Elections in XR
A Unity application with a Google Realtime DB that allows users capture interesting moments of a political debate in a networked, augmented-reality interface.
↳
ITP Thesis: Library of Wanders
An interactive network visualization for a biblio-centric collection of texts, featuring "hand-woven" connections between each item and an Are.na backend.
↳
100 Days of 3D Scans
This Instagram project intends to capture 100 days of practice around the art of 3D scanning. It is an impetus to experiment with different subjects and methods.
↳
Enigma: Interactive Map of Gold Imports
A interactive map of U.S. gold imports created in conjunction with larger research project.
↳
Workshop: Data Visualization with Python + Adobe Illustrator
An introduction to a Python pandas + matplotlib + Illustator data visualization workflow. Run for 2019 ITP Camp.
↳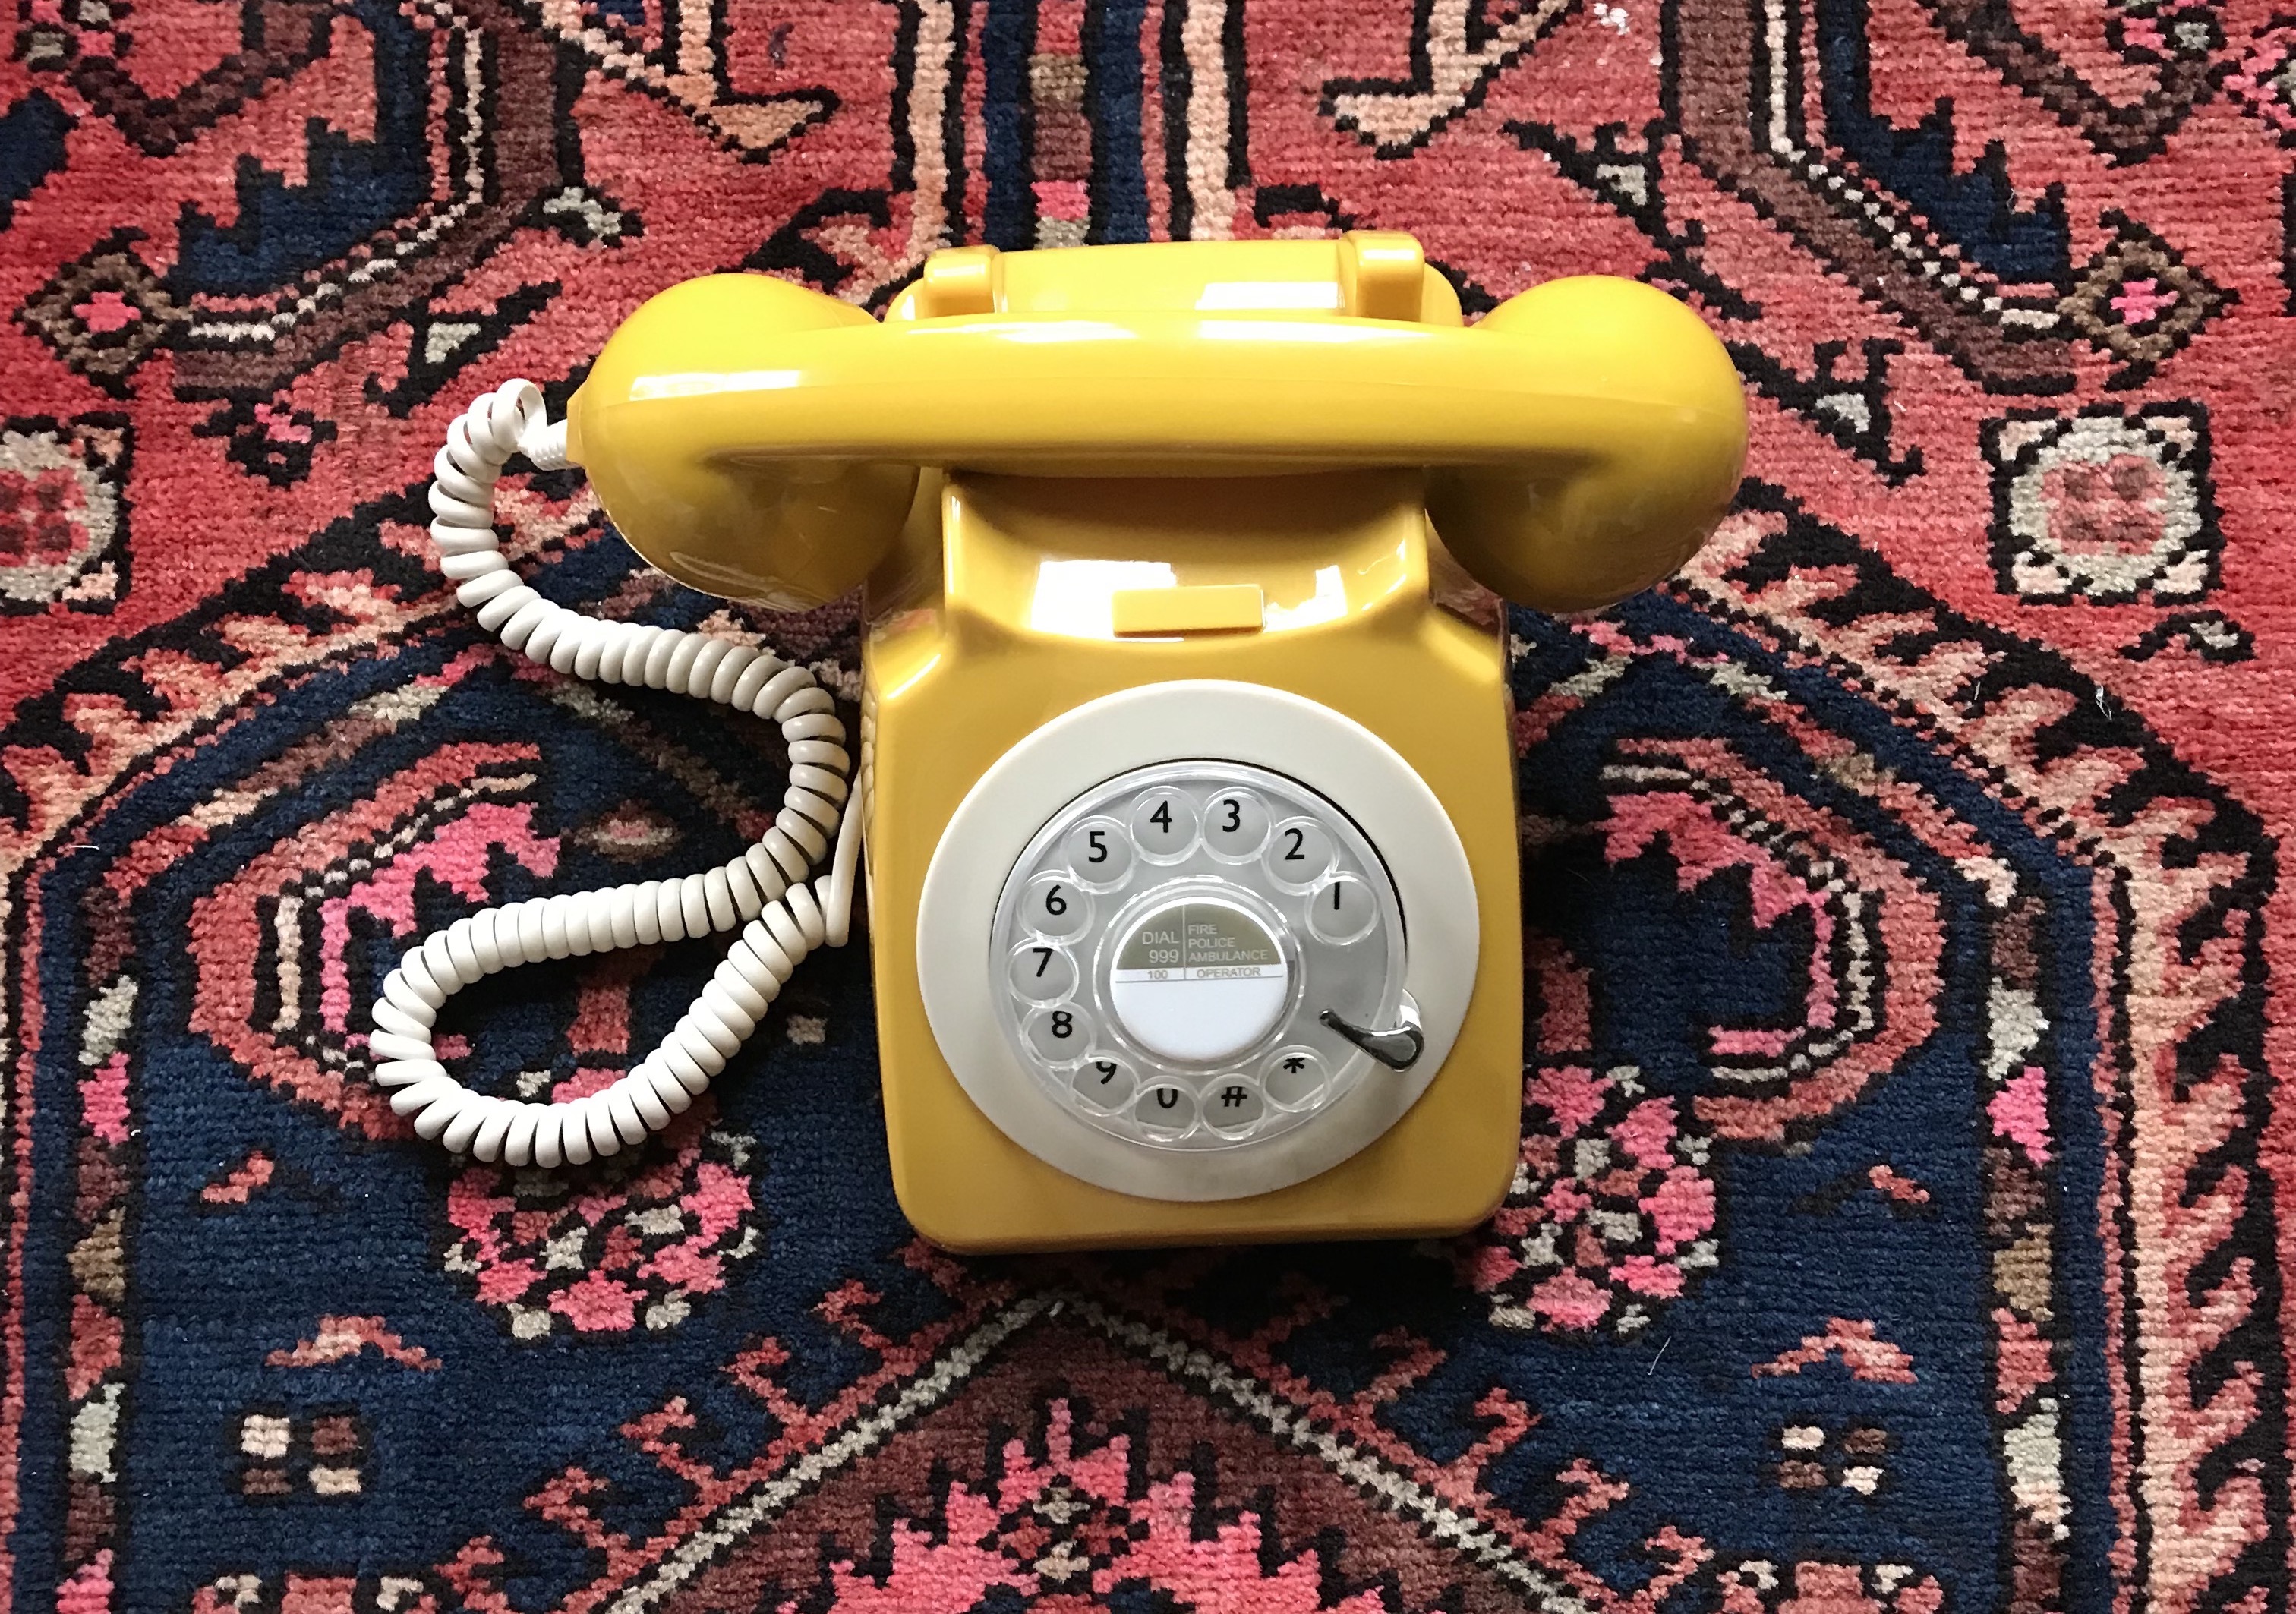
Calling Alexander
A 1970's rotary phone that has been programmmed to summon documents from the Library of Congress.
↳
Exploding Glitter Cake
A capacitive touch cake that explodes with glitter when cut. Uses Amitabh Shrivastava's Programmable Air project for pneumatics.
↳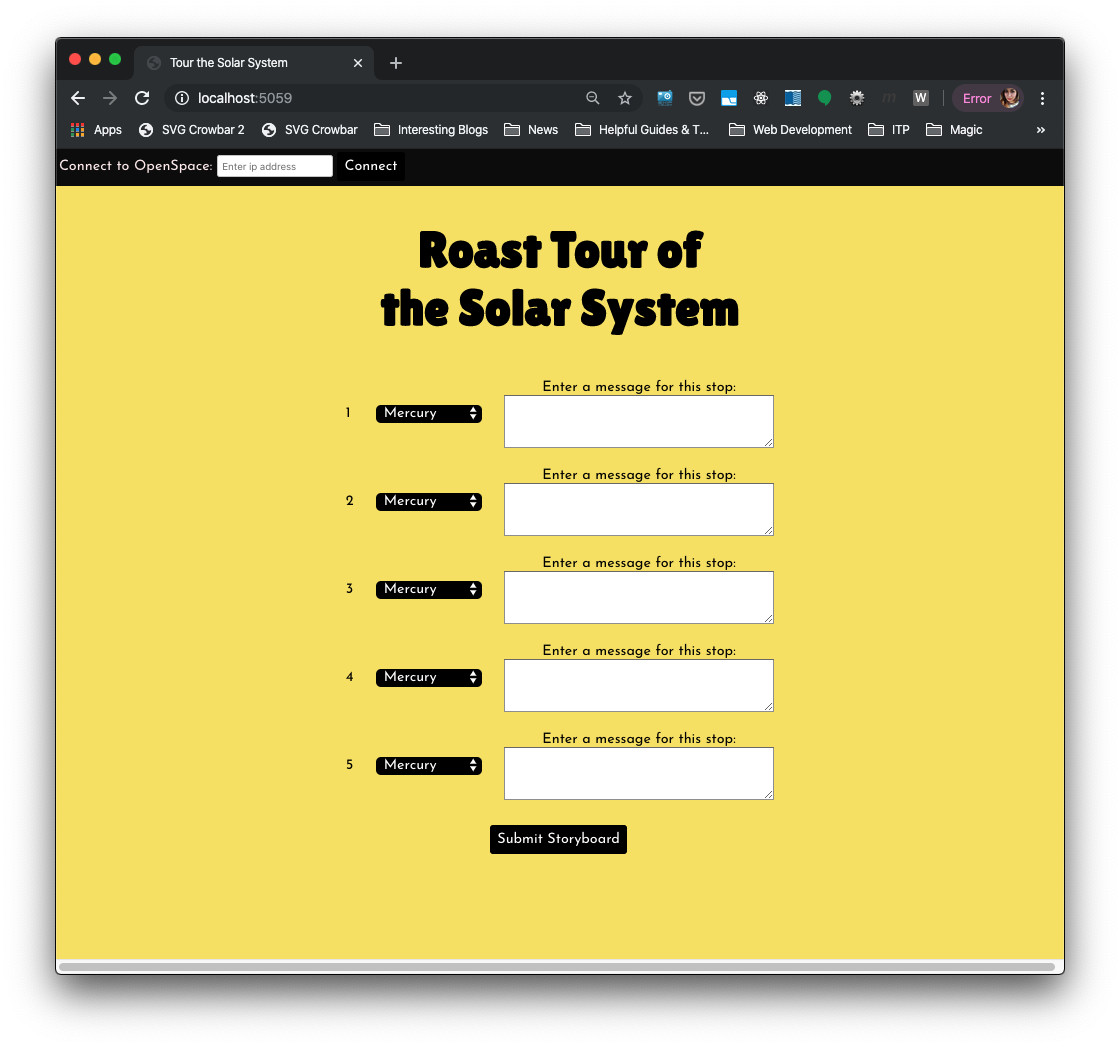
Web Tool for Open Space
A browser interface for controlling the navigation on AMNH's Open Space planetarium system. Made for the LES Girls Club.
↳
Growver
A power-saving, sun-loving bot that periodically roams and sleeps. In collaboration with James Hosken.
↳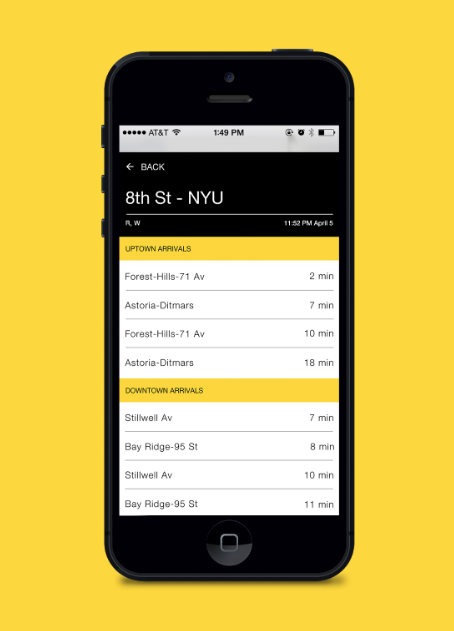
Access to Places
A prototype for a mobile application that seeks to make NYC Subways navigable for blind and visually-impaired travellers. In collaboration with Emily Lin, Antonio Guimaraes, and Luming Hao.
↳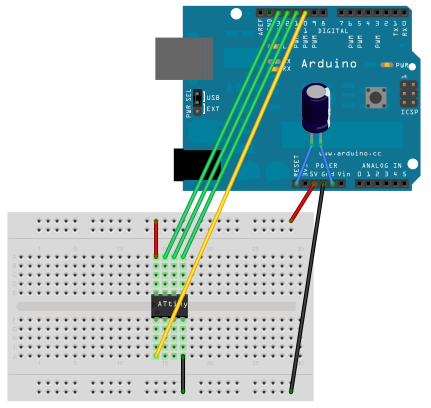
Workshop: Tiny Chip, Mega Fun
A workshop run for 2019 ITP UnConference. Teaches participants how to program an ATTiny85 chip and run code to control Neopixel strip.
↳
Music Between Us
A pair of jackets embroidered with conductive thread. Touching the jacket in various locations triggers a soundscape. In collaboration with Jiwon Shin.
↳
Grapevine: A Chrome Extension
An extension that hides content from anonymous sources in NYTimes articles.
↳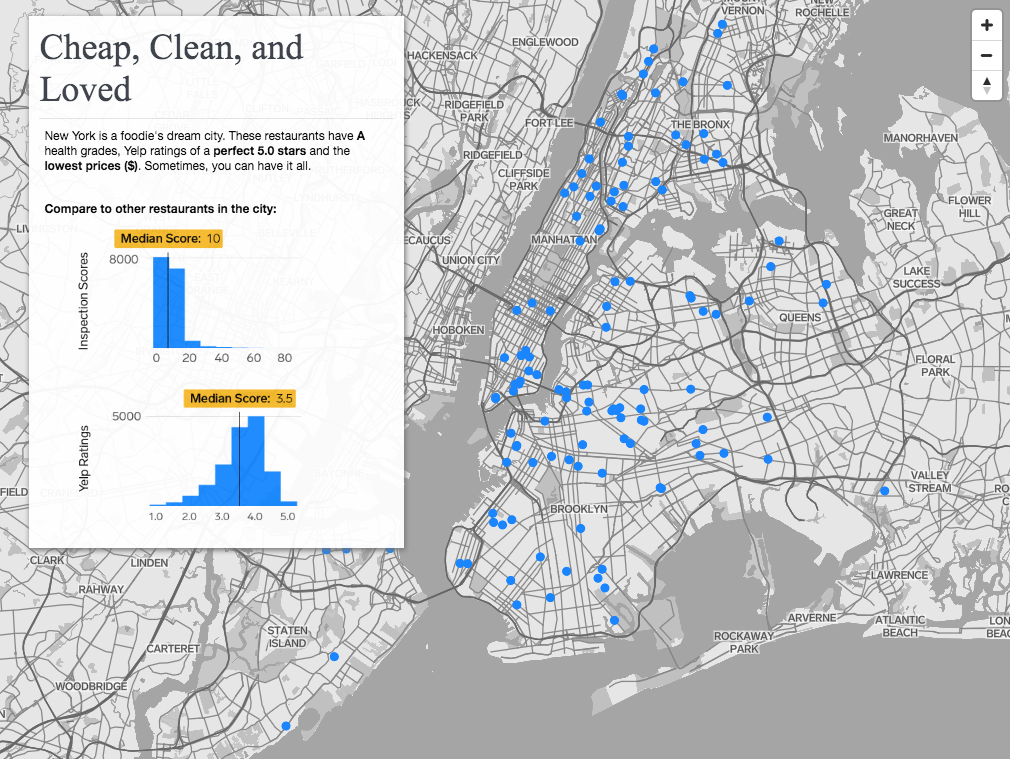
Enigma: Restaurant Grades App
A series of Mapbox maps showing restaurant health grades and related data. In collaboration with Vivien Ngo.
↳
Alchemy
A webgame that highlights privacy risks associated with consumer actions. In collaboration with Eileen Townsend, Kevin Sun, and Laurent Bastien Corbeil.
↳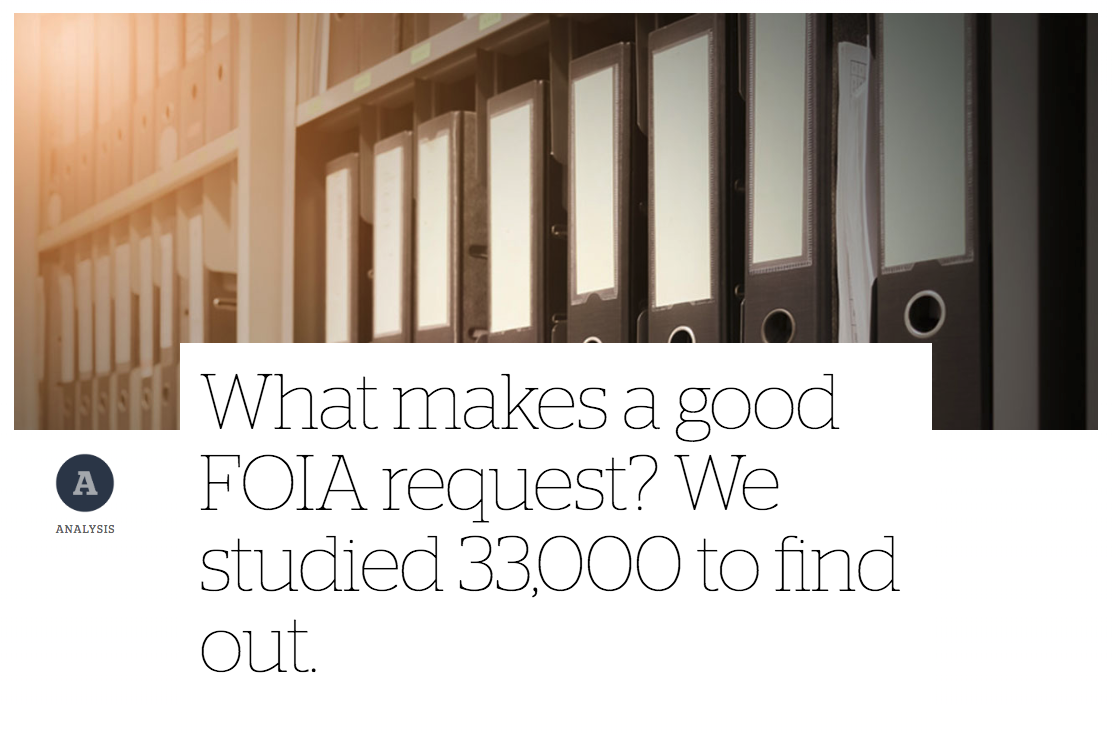
Columbia Journalism Review: What makes a good FOIA request?
An textual analysis of over 30,000 FOIA requests. Primarily involvement was in scraping the related data from FOIA.gov. In collaboration with Nic Dias and Laurent Bastien Corbeil.
↳