Rashida Kamal

Some highlights from my role at the Guardian
My role at the Guardian requires me to (1) find and analyze data, (2) report and fact check what I see, and finally, (3) visualize the most interesting parts. I've been on the team since October 2020, and have covered a wide range of topics in that time (everything from the elections to vaccines to unemployment to wildfires).
I've featured some of those pieces here.
You also check out my profile on the Guardian website for additional pieces with bylines.
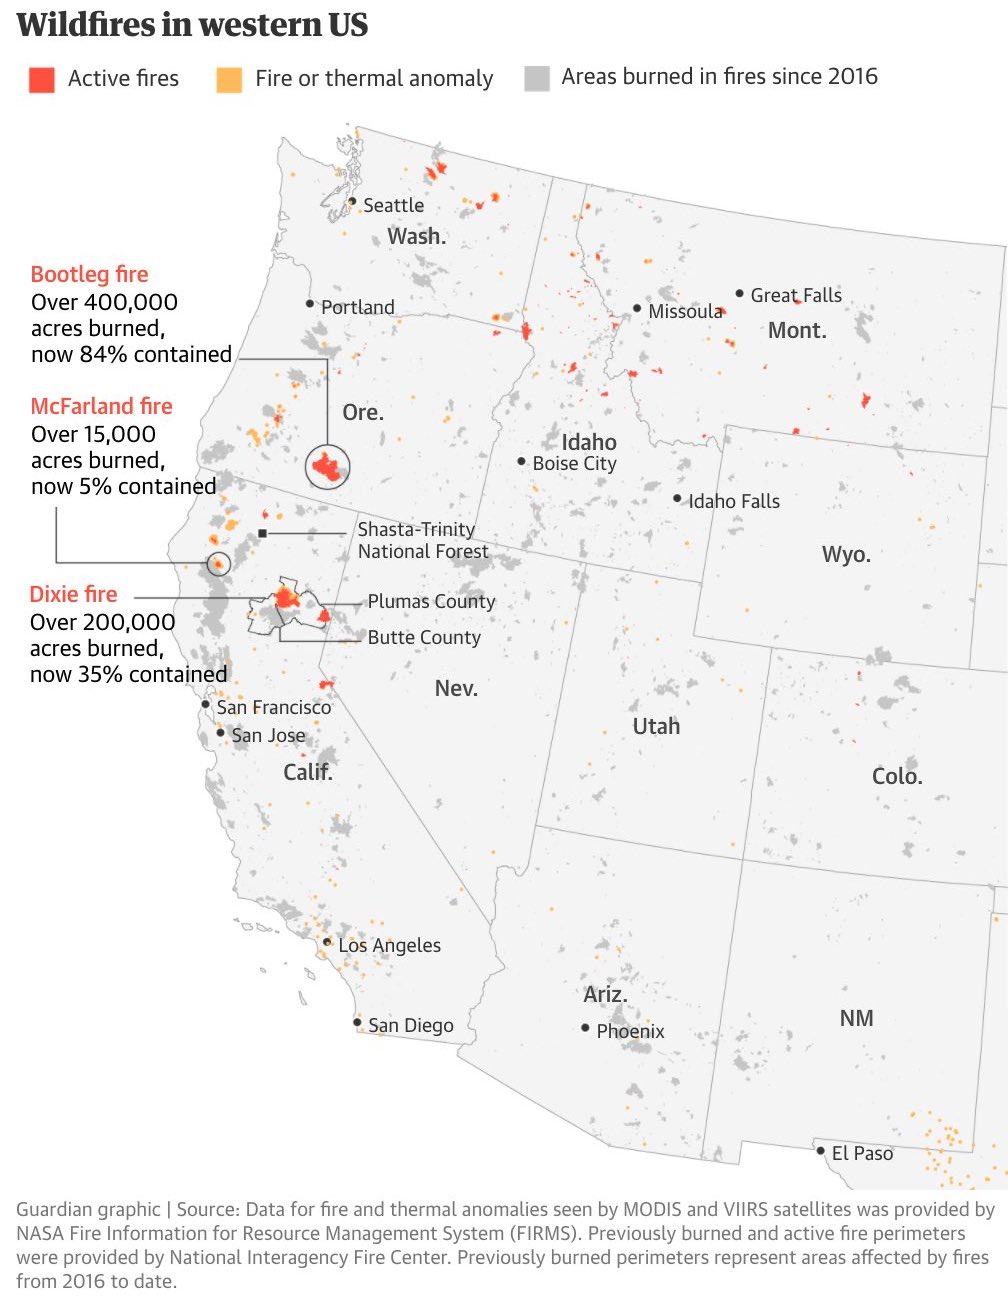
California’s largest wildfire explodes as hot weather threatens new blazes
Role: I built a Node app to automate (1) fetching data from government websites on a daily basis, (2) cleaning up (Turf.js) that data, and (3) making SVG basemaps using D3.js, server-side. I then annotate the base maps in Adobe Illustrator, and produce the final version using AI2HTML. This is one example of a map created using that process.
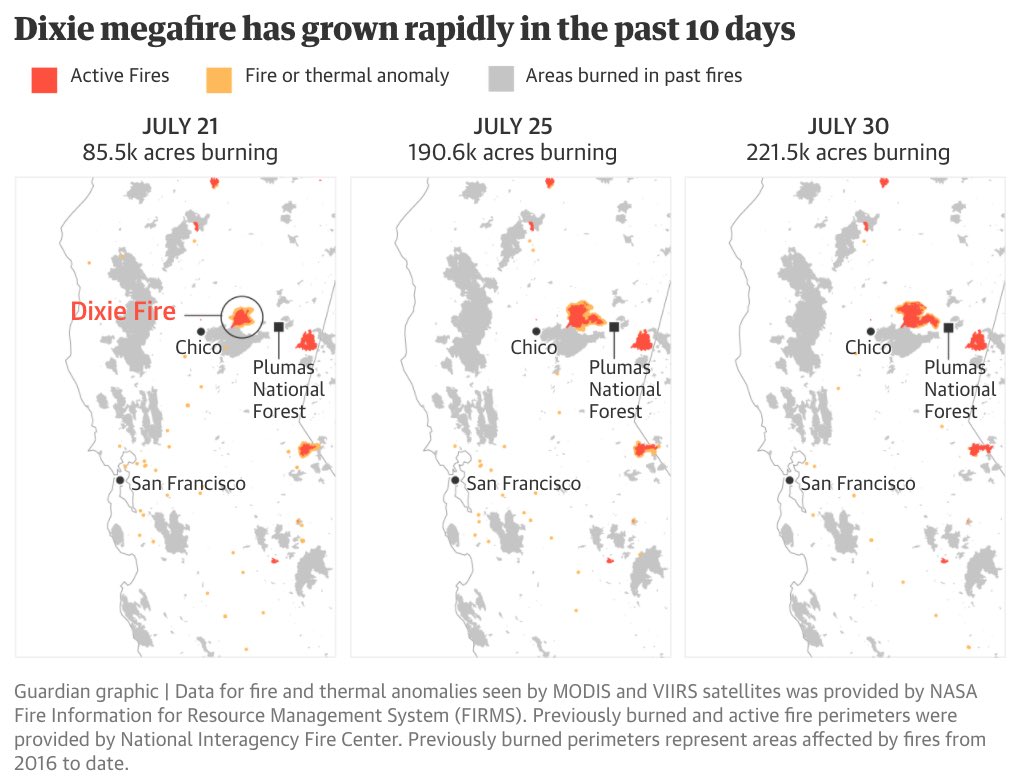
In the shadow of Paradise, nearby residents make uneasy peace with fire
Role: Another example of maps created using my wildfire graphics rig.
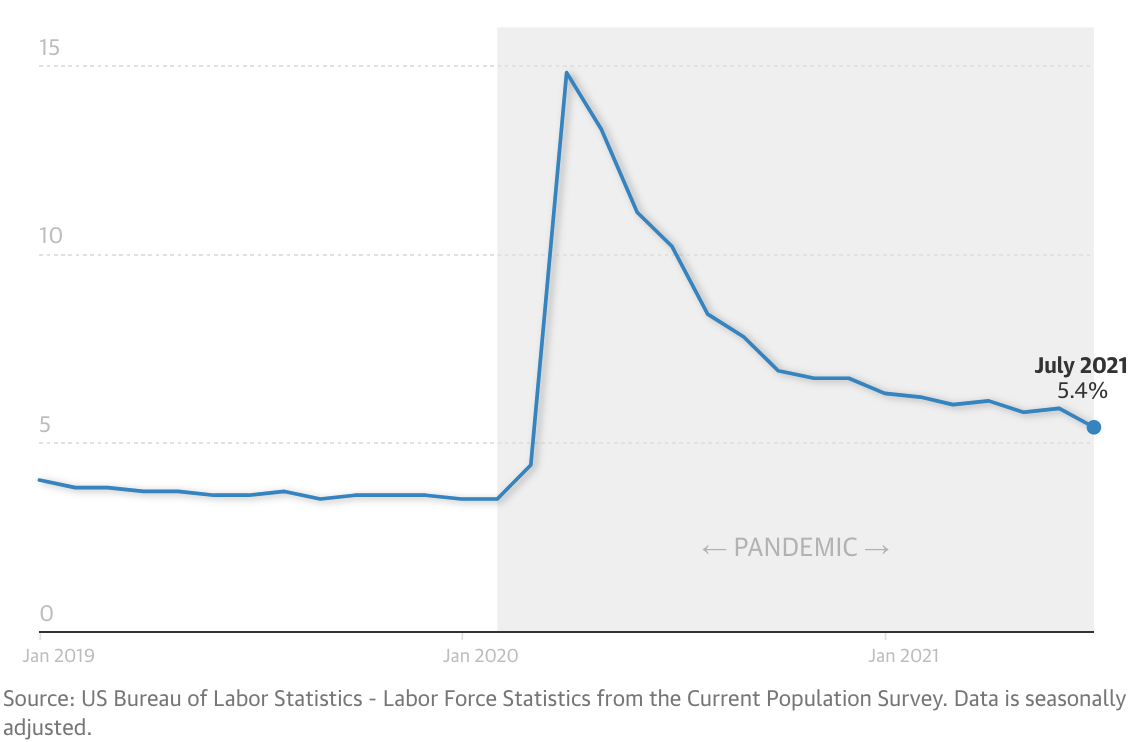
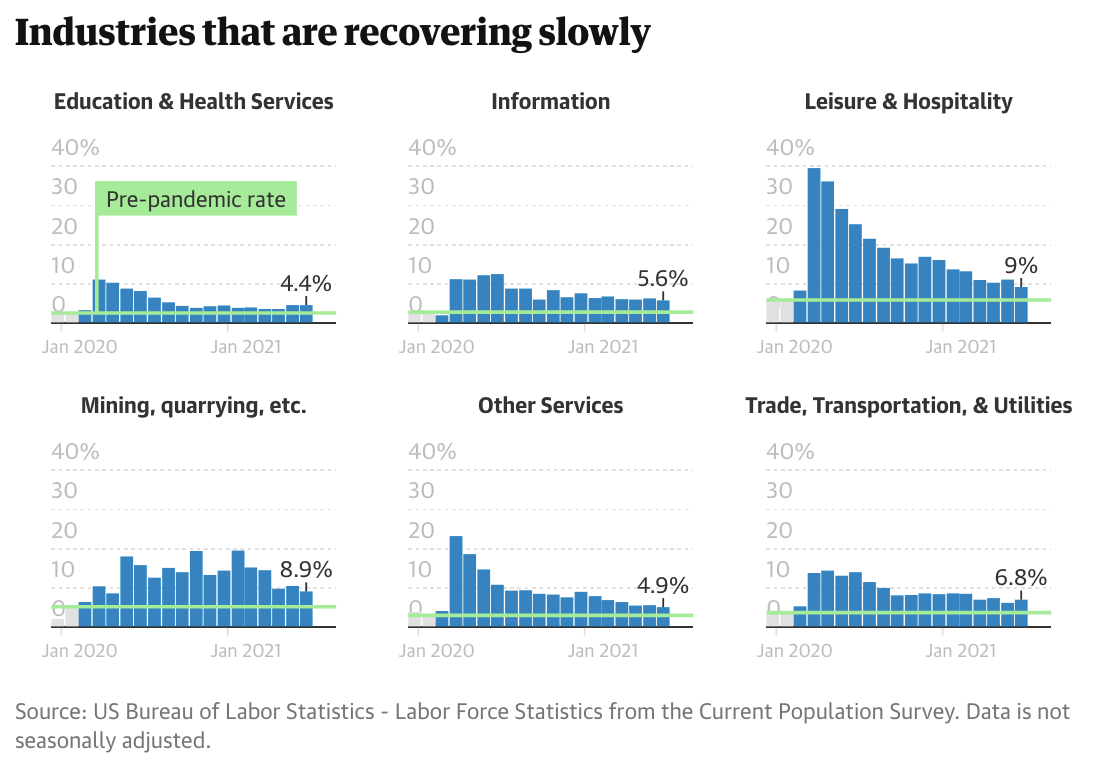
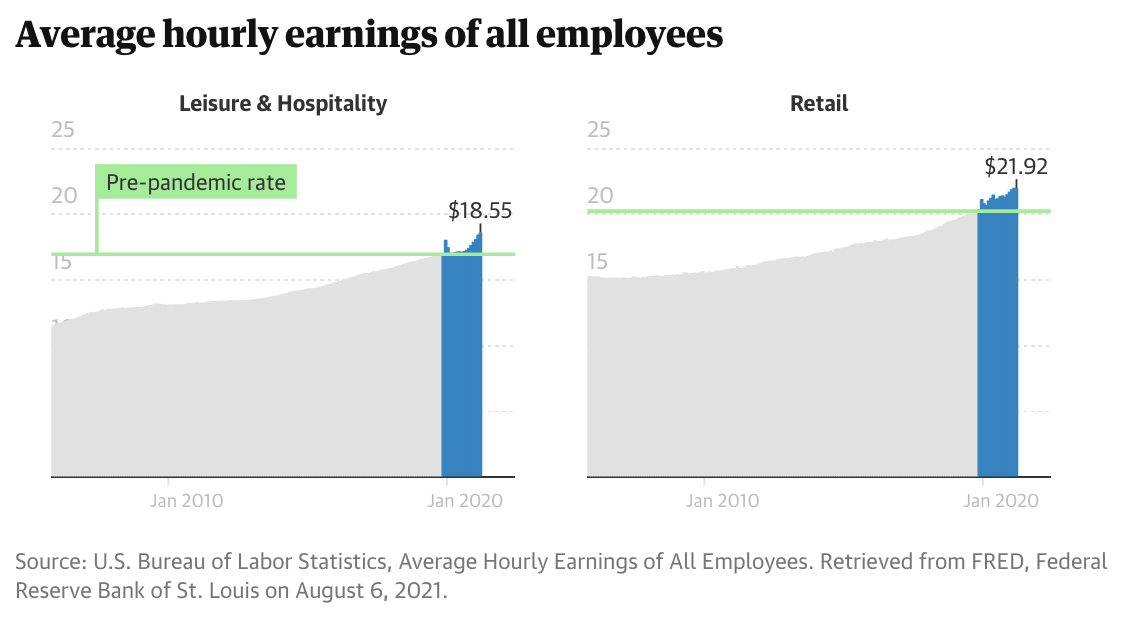
July US jobs report shows growth – but these industries are slow to recover
Role: I've been covering the monthly jobs report, and have built out some reusable scripts in Python and Javascript/D3 to create the graphics below. The first chart shows the unemployment rate.
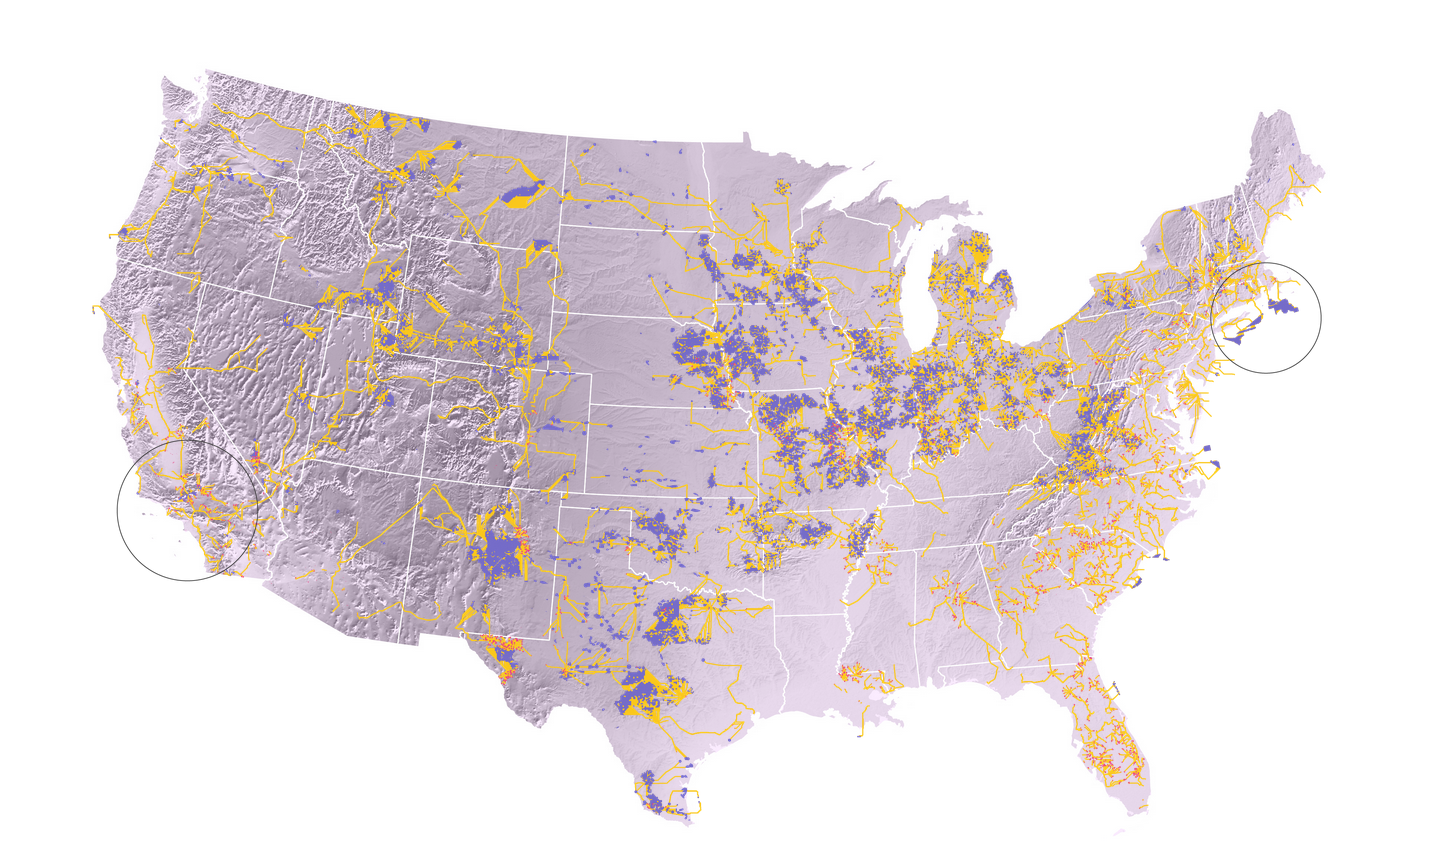
The race to zero: can America reach net-zero emissions by 2050?
Role: Created a number of maps in QGIS. Article includes legend and text annotations.
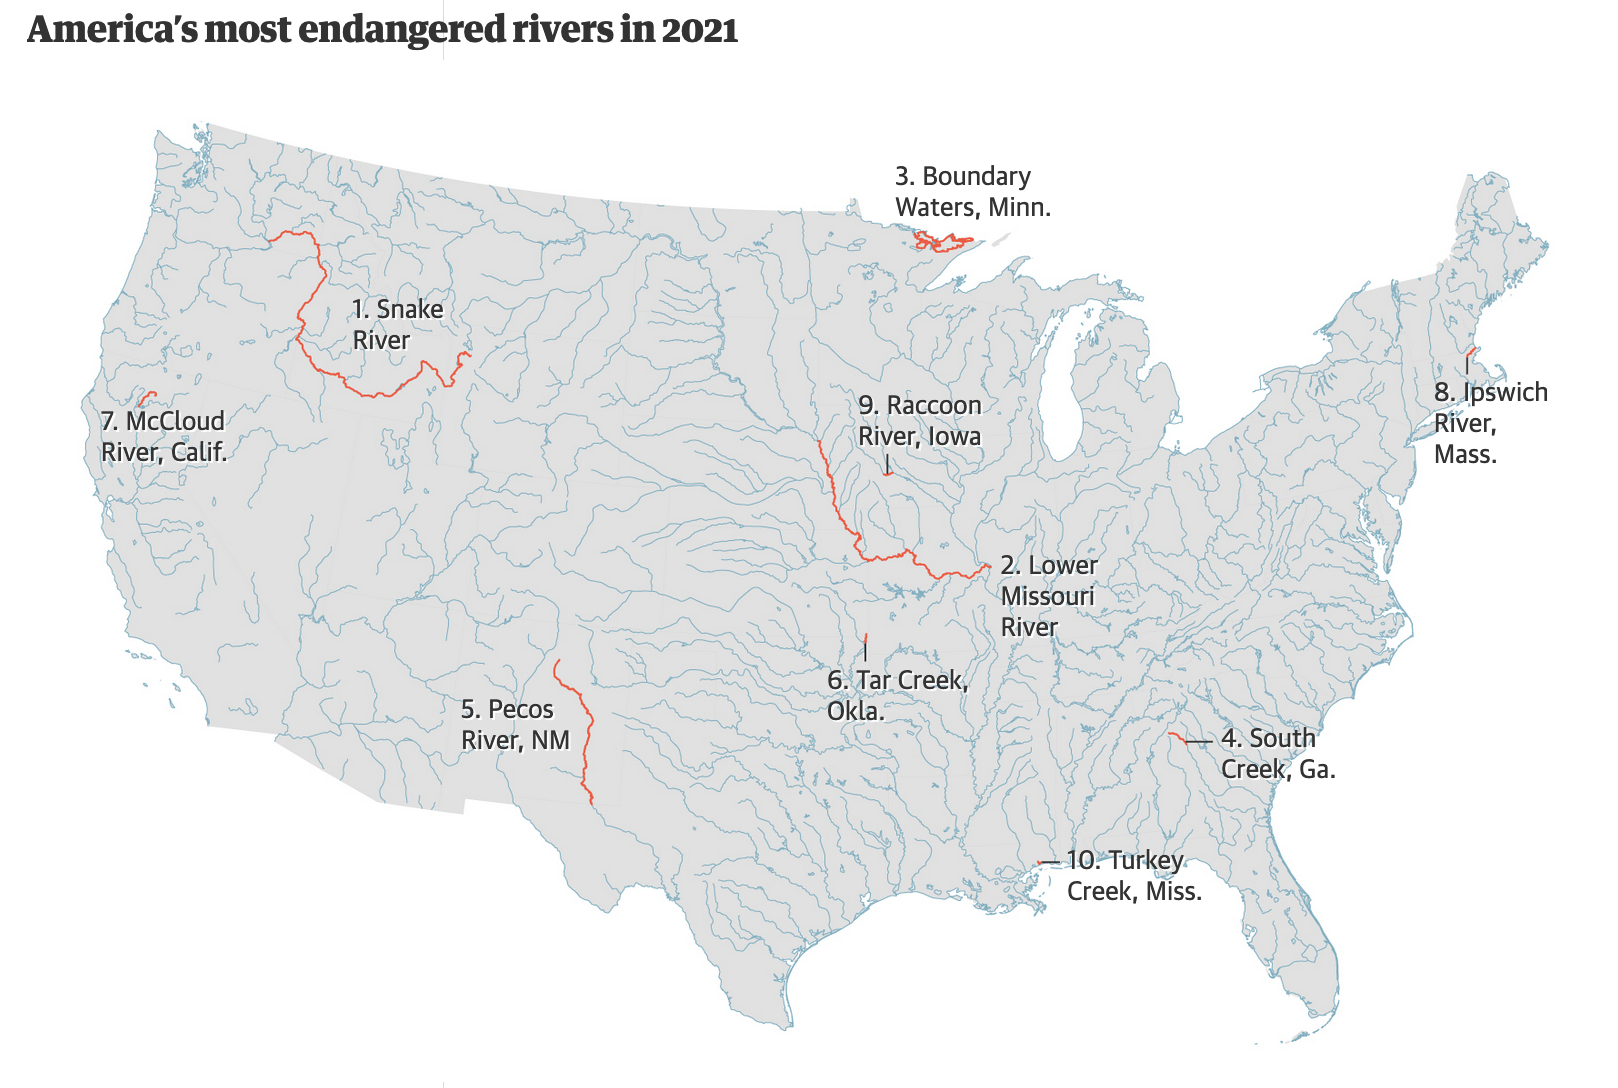
Endangered US rivers at grave risk from dams, mining and global heating
Role: Created maps in QGIS, with annotations added in Illustrator.
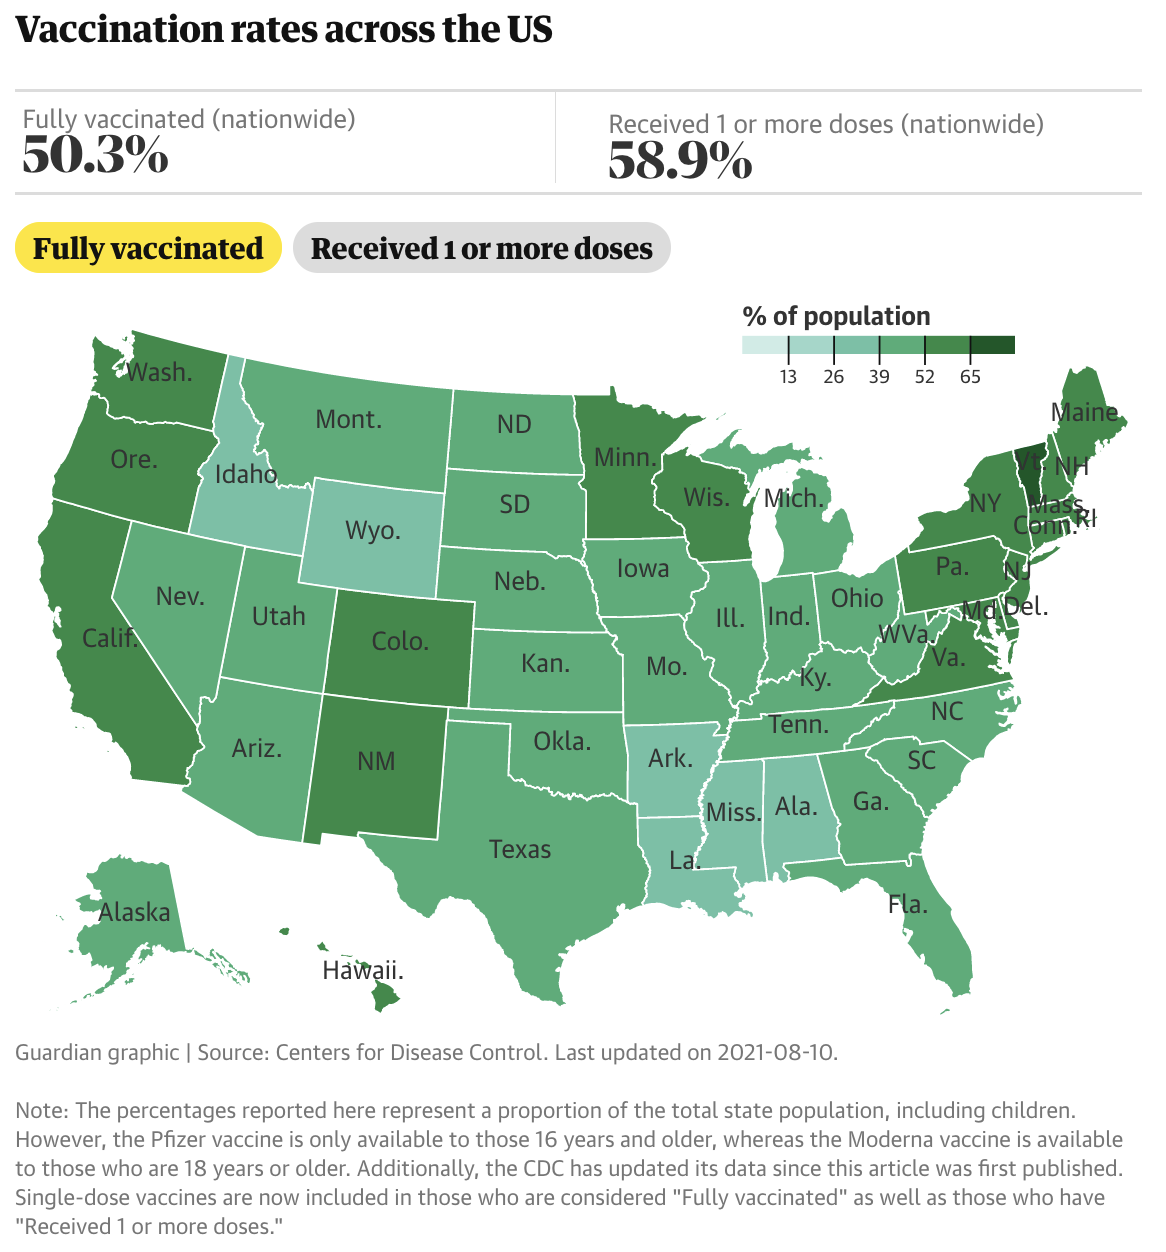
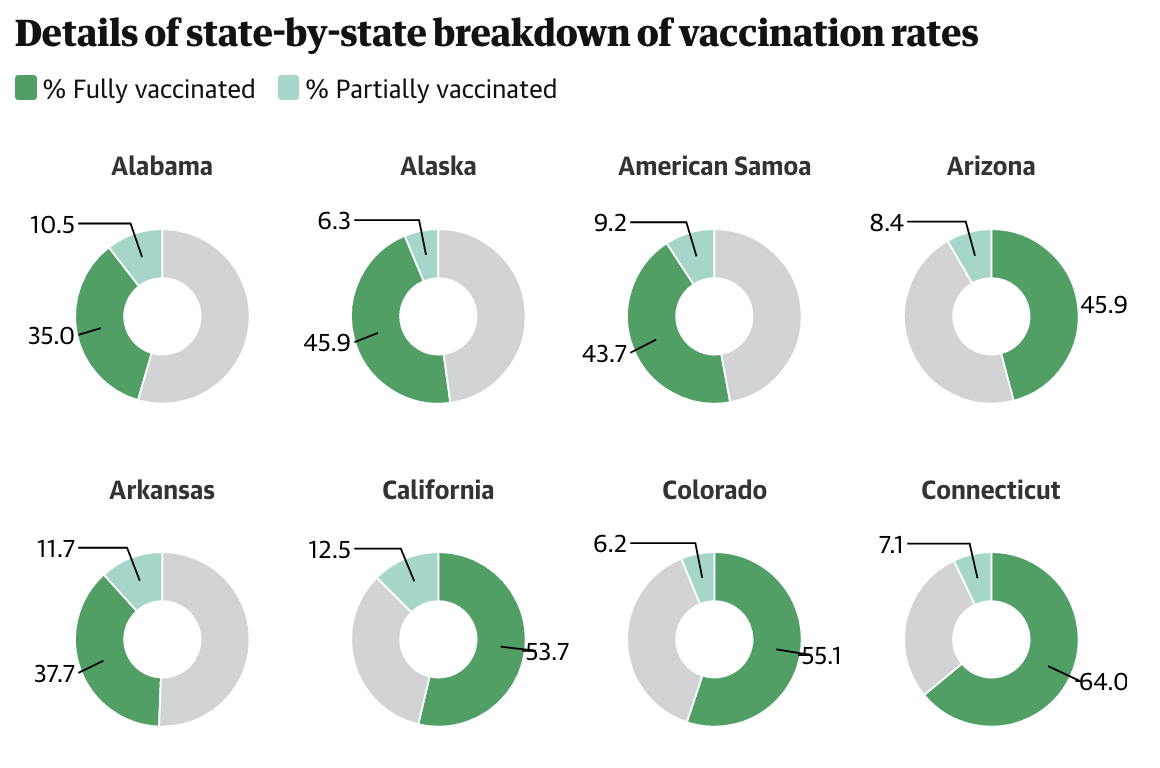
US vaccine distribution: track your state's progress
Role: Built a rig to regularly pull CDC data to update a number of D3 interfaces up-to-date with the latest data (no intervention needed).
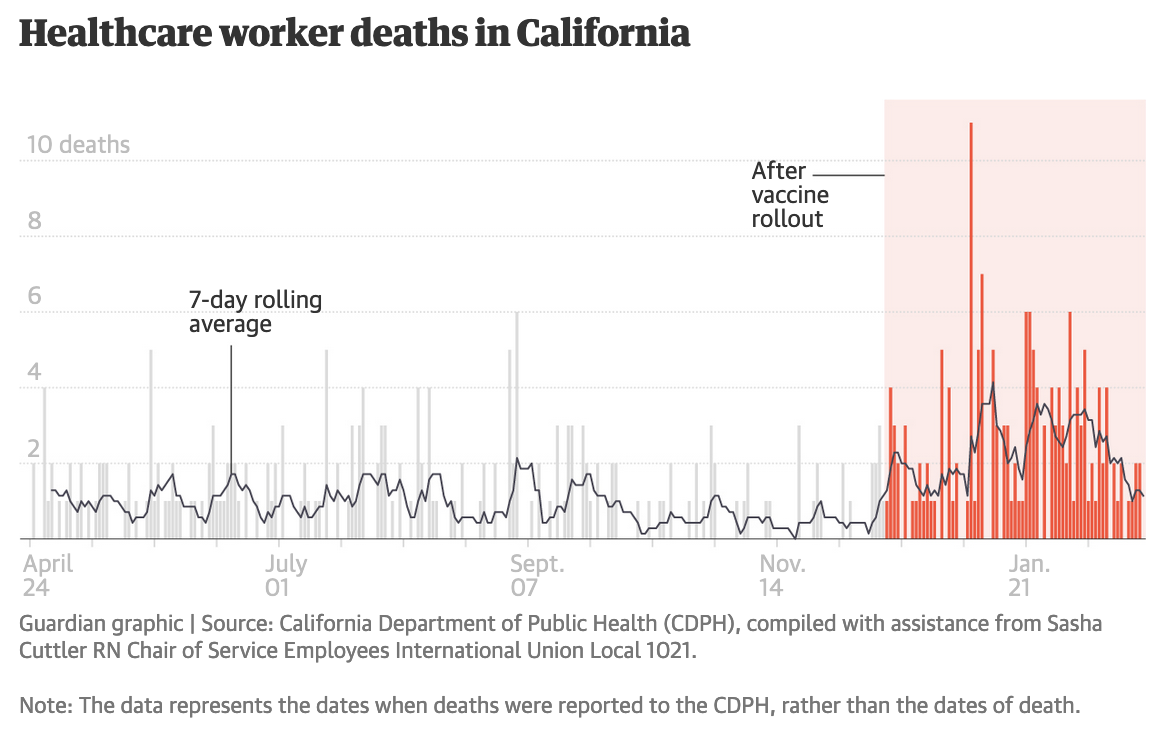
At least 400 US healthcare workers have died of Covid despite vaccine rollout
Role: Created base graphic using Python (pandas and matplotlib), and then polished graphic in Illustrator.
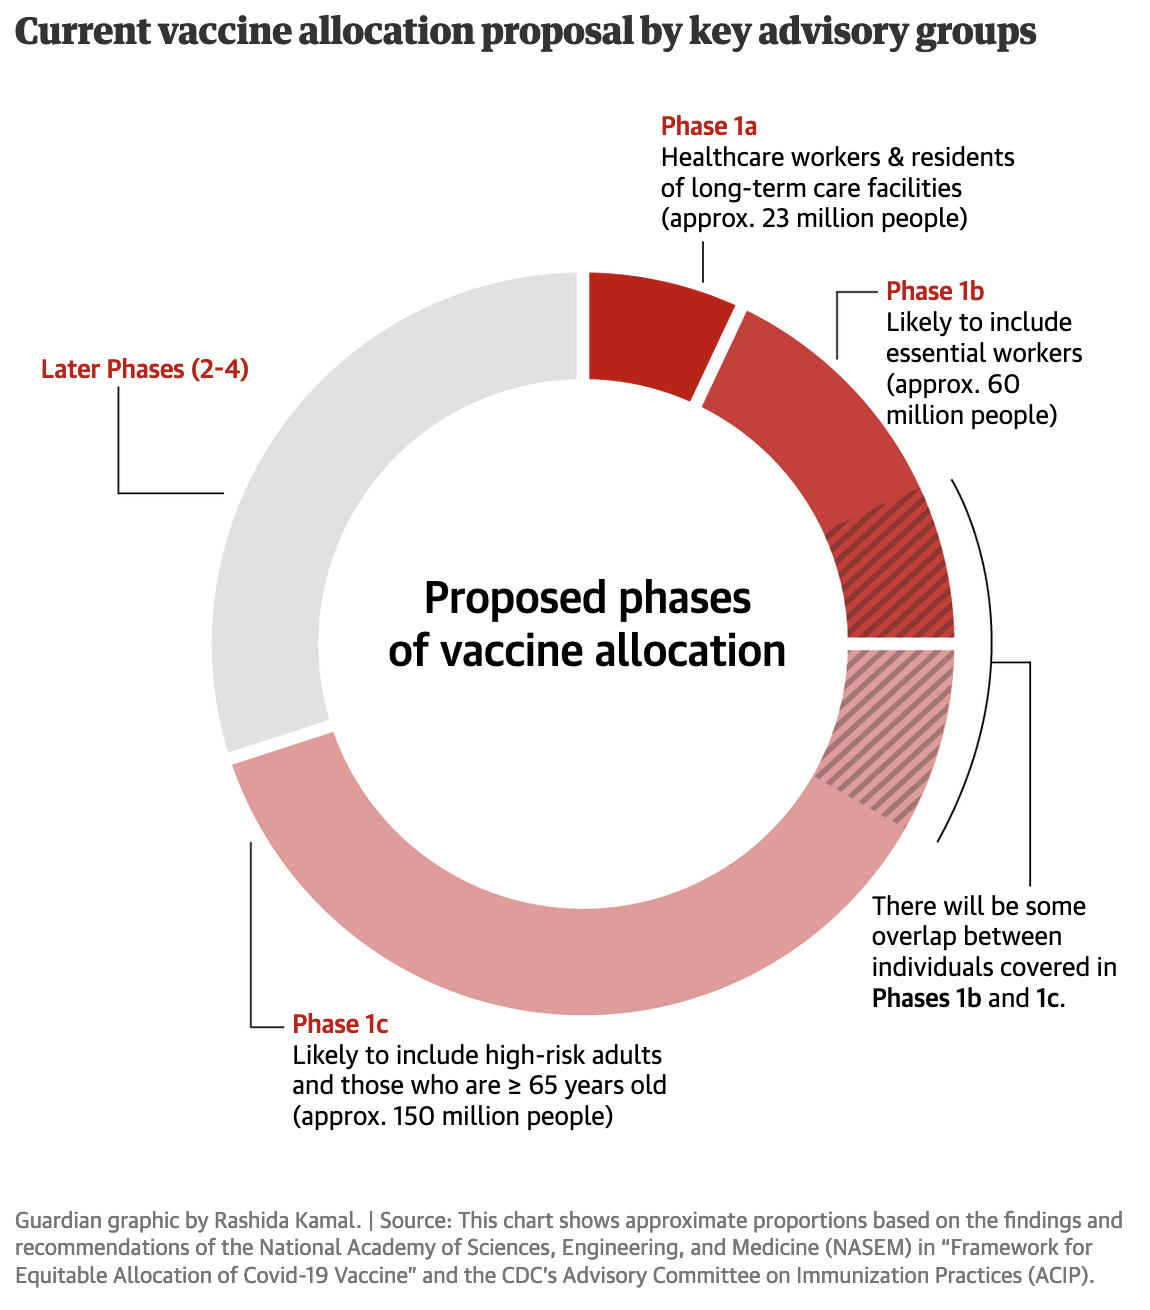
The FDA has authorized two vaccines so far – here's what you need to know
Role: Created base graphic using Python (pandas and matplotlib), and then polished graphic in Illustrator.