Rashida Kamal

Enigma - Newsletter Graphics
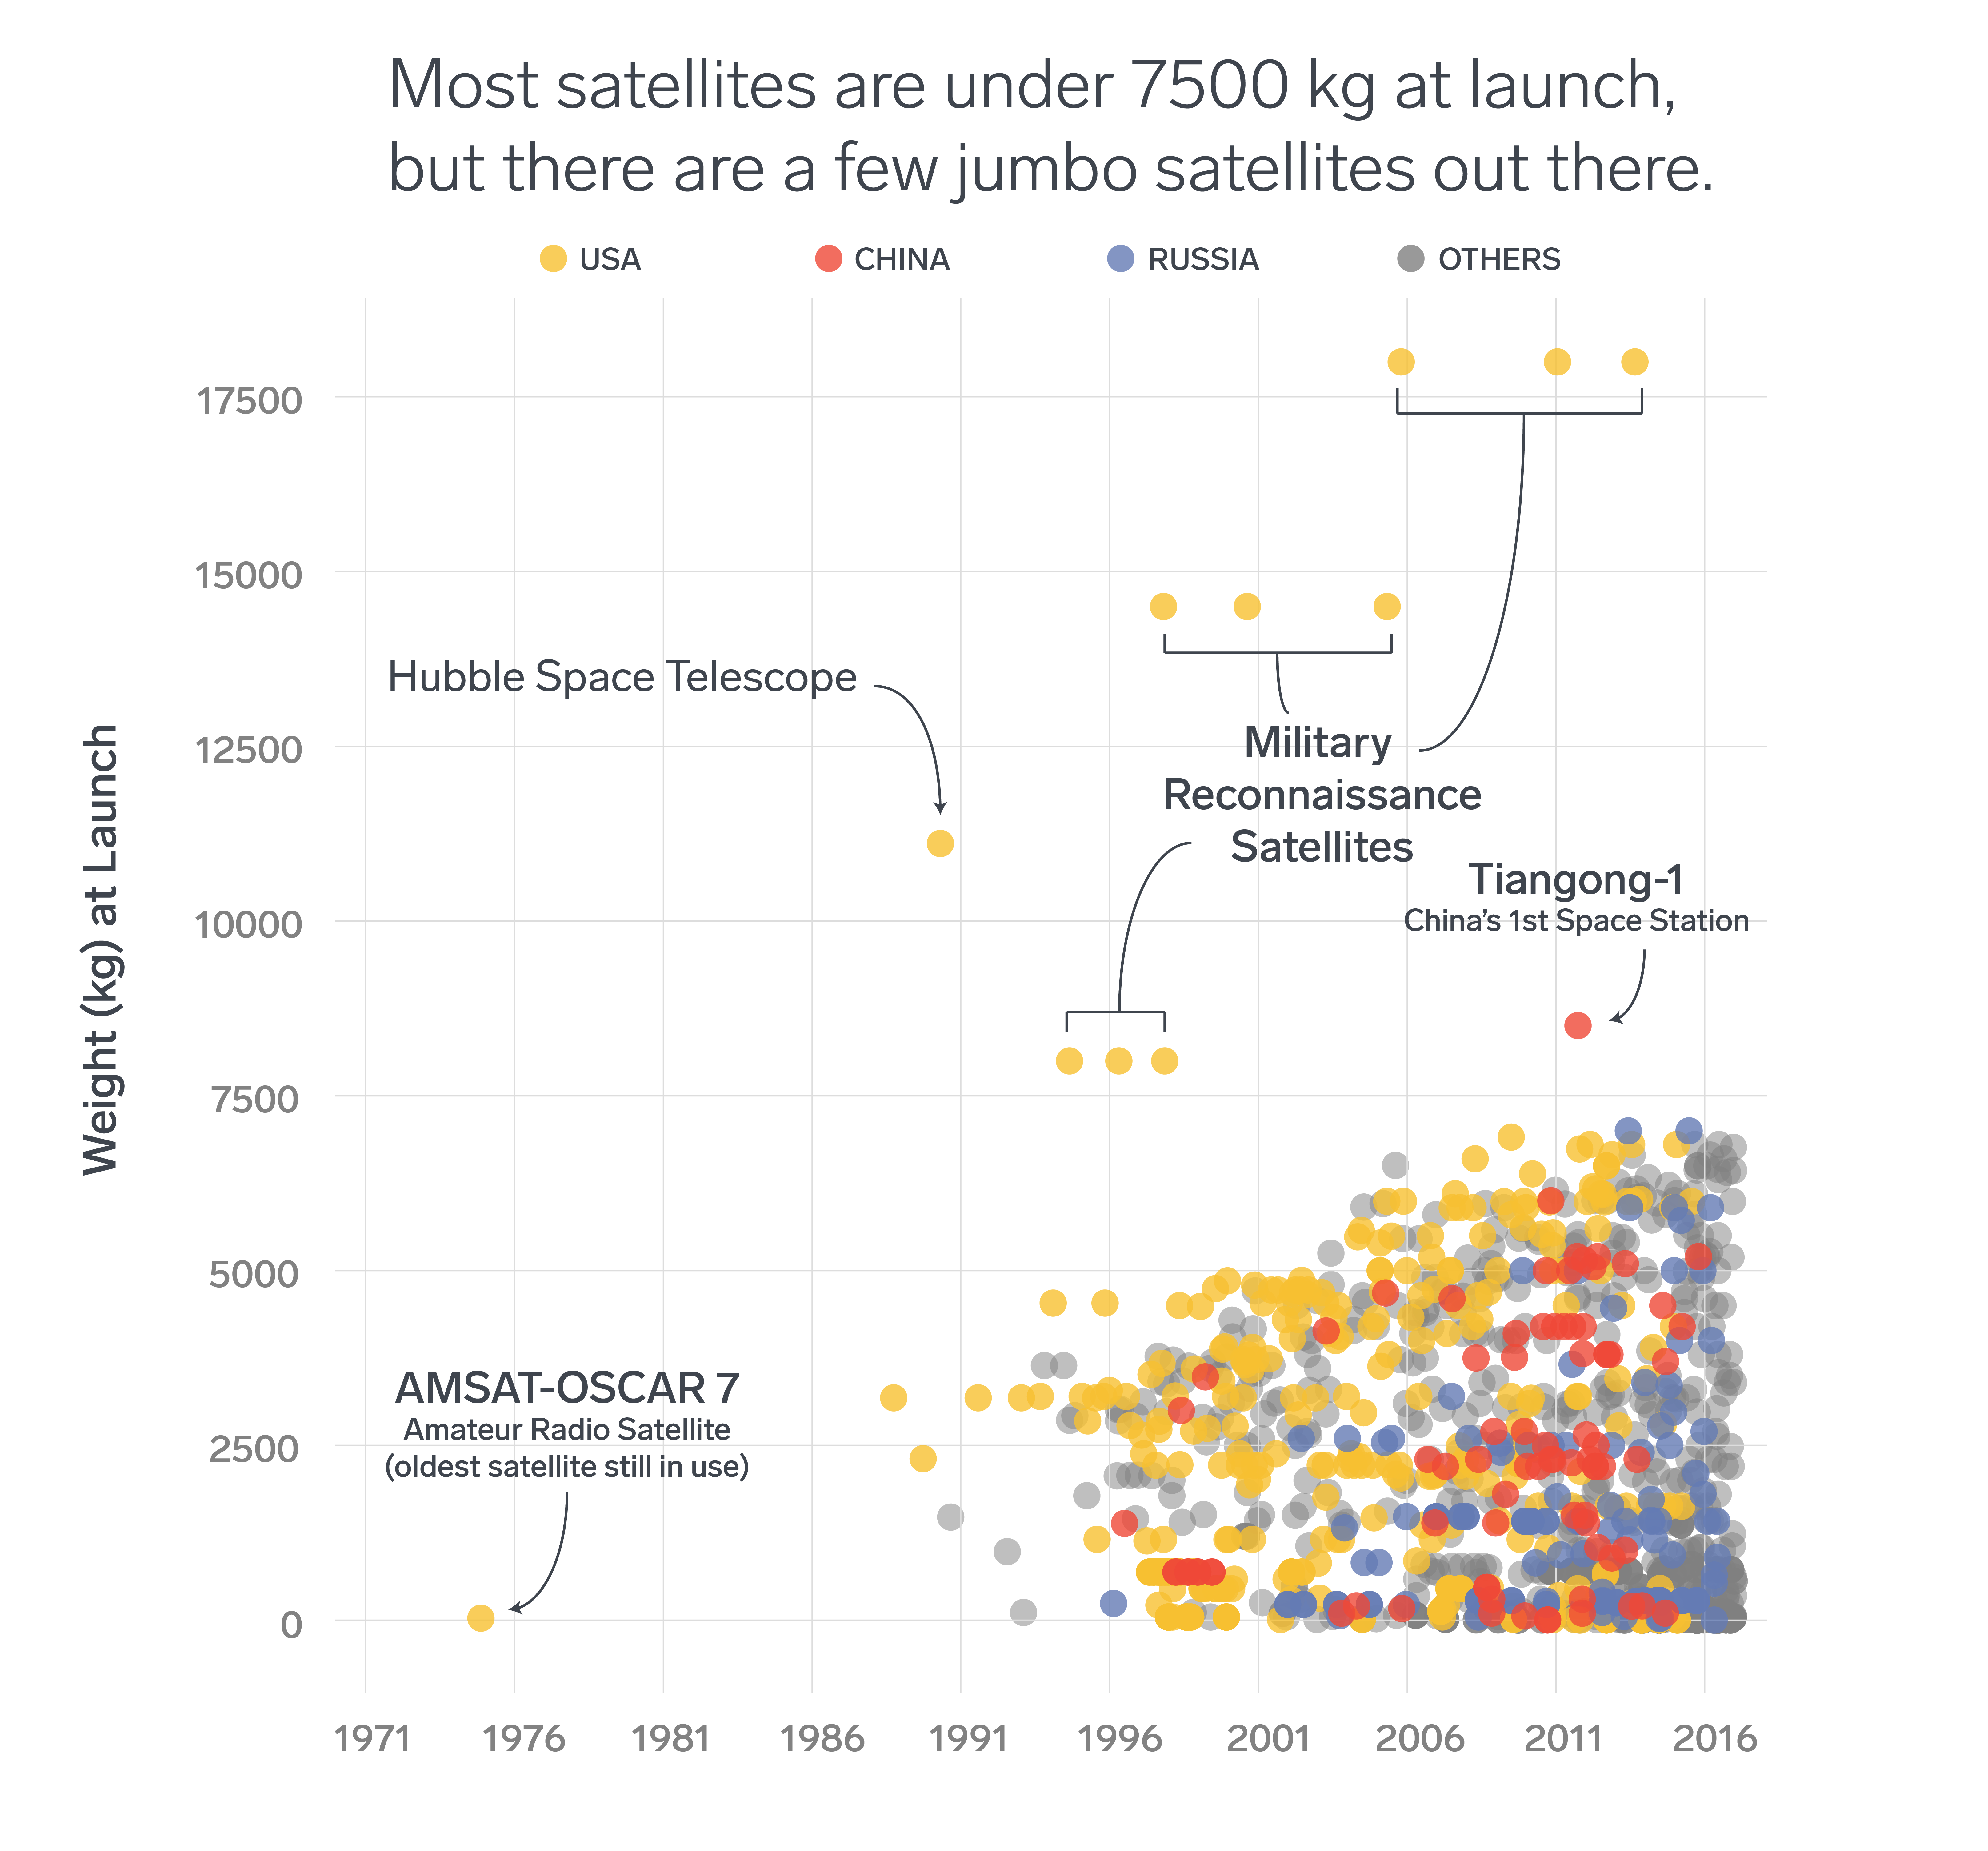
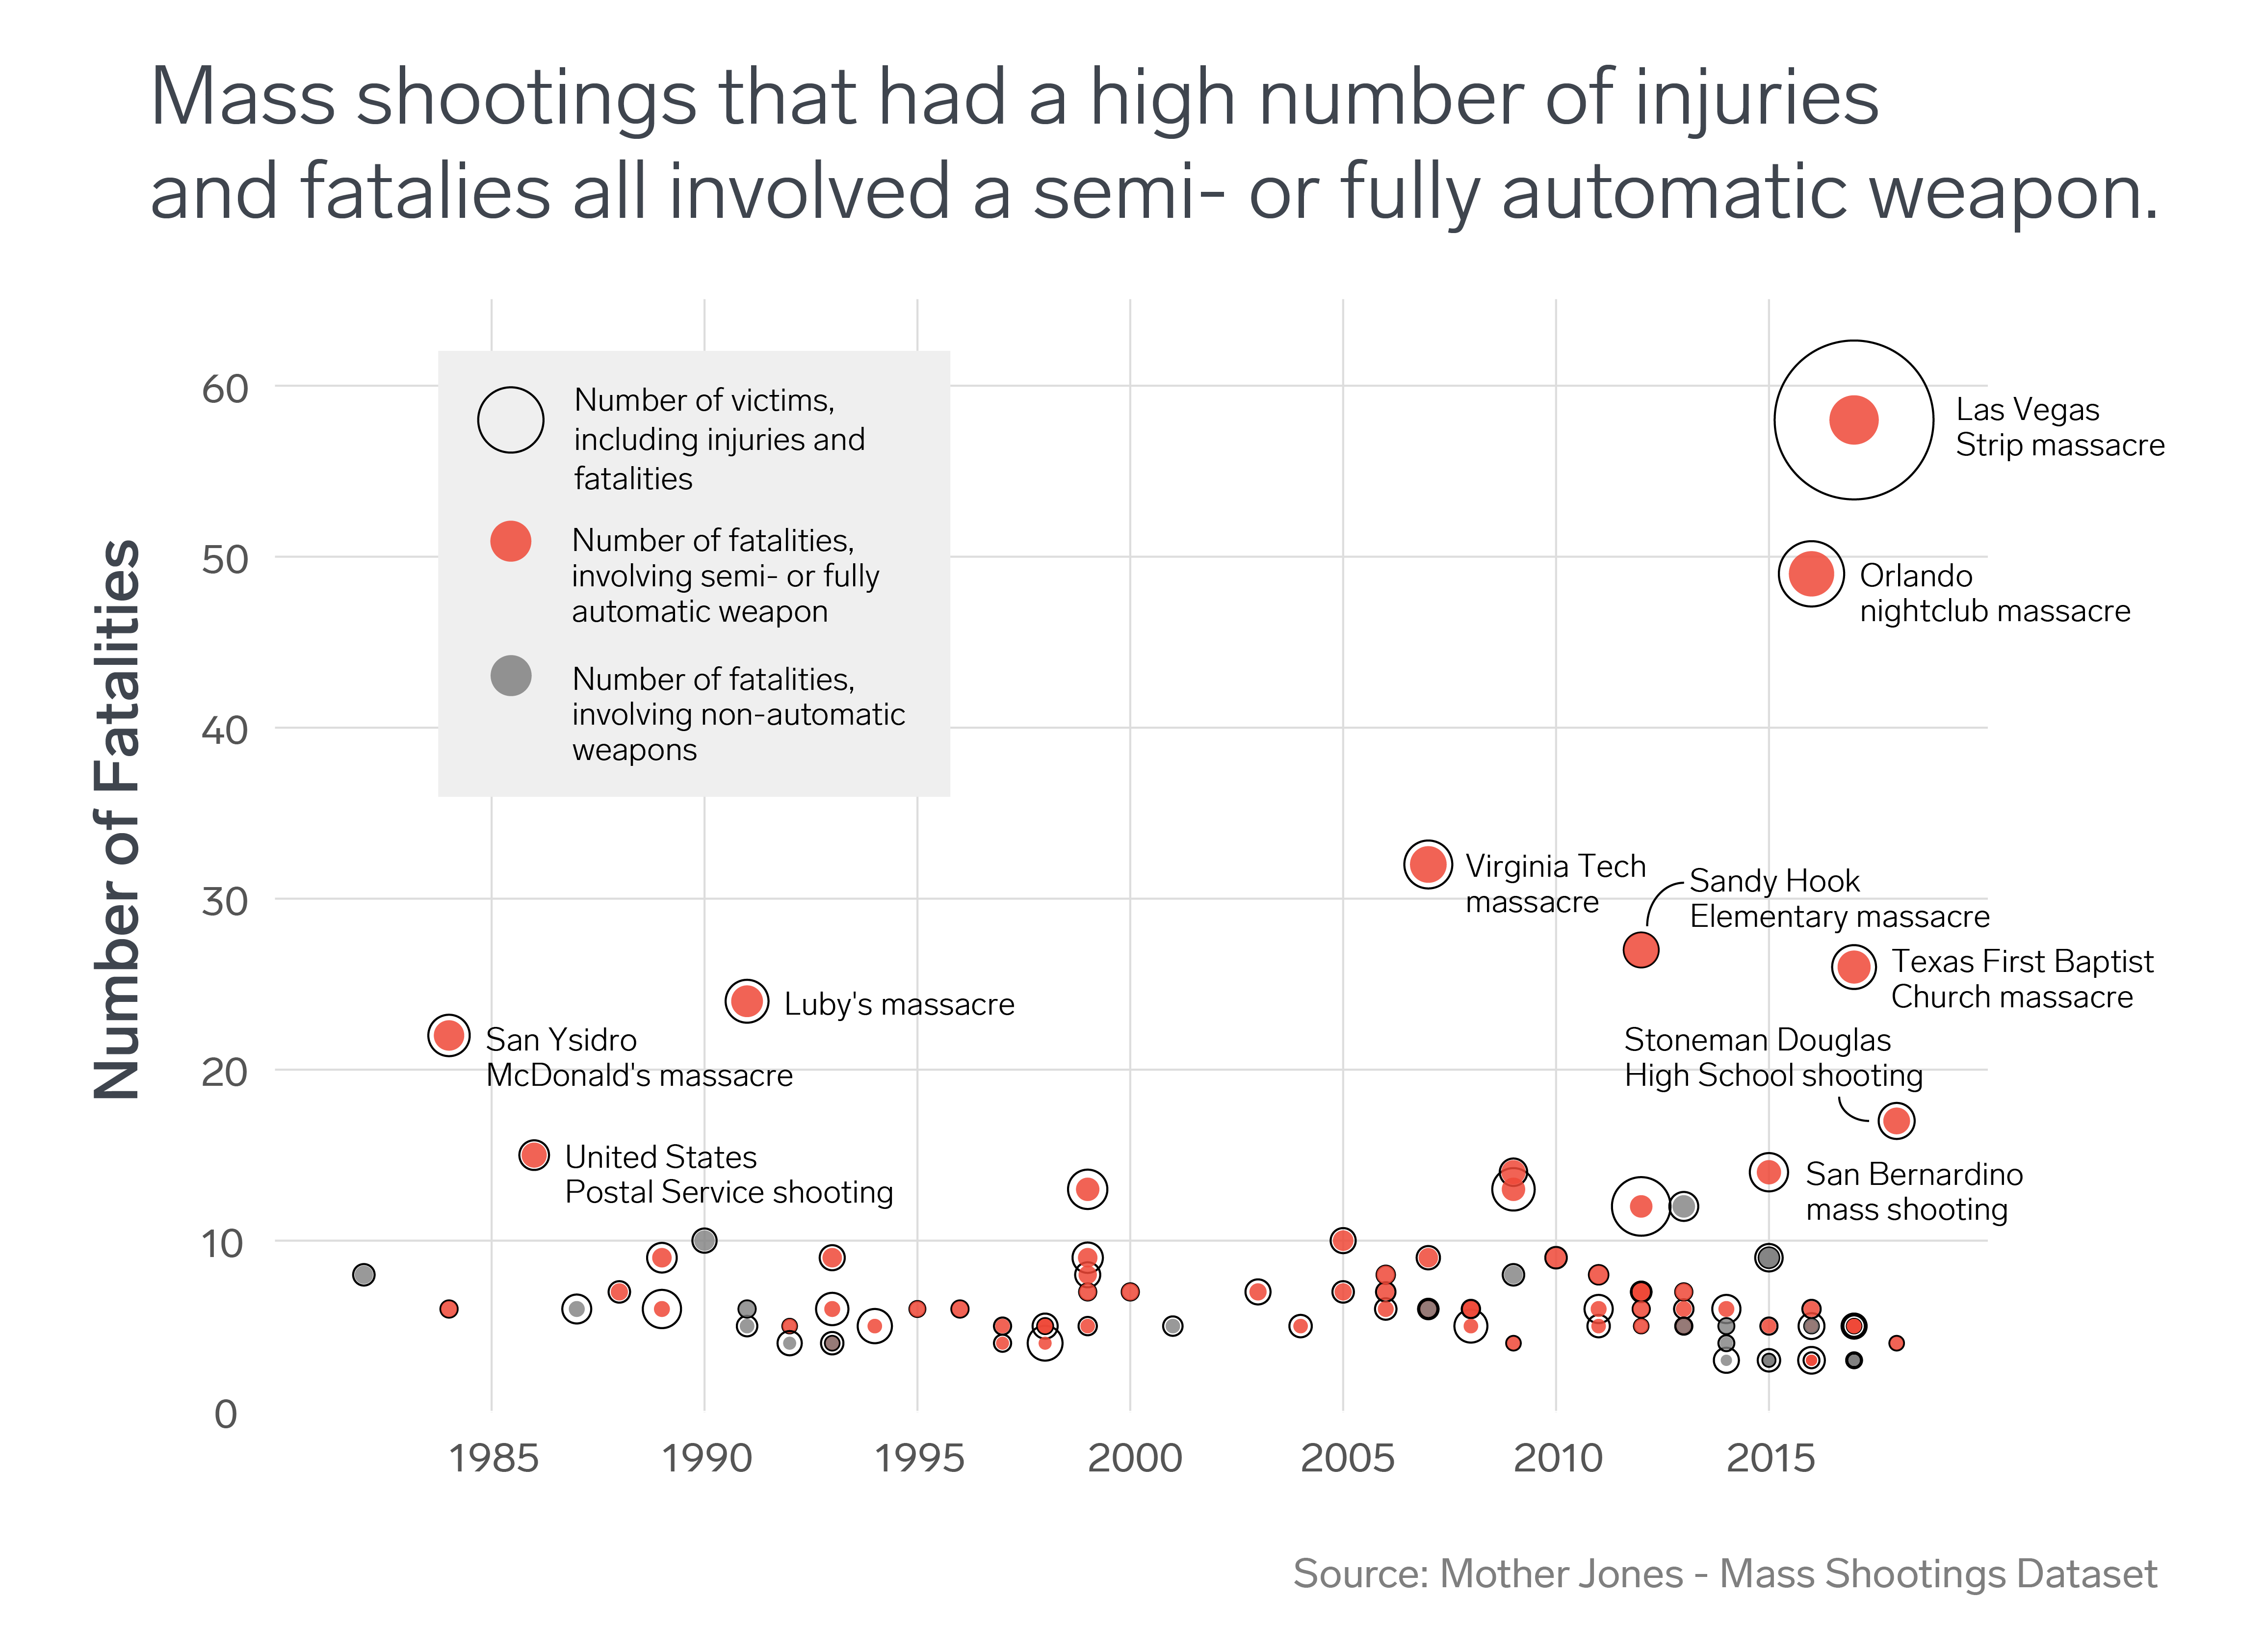
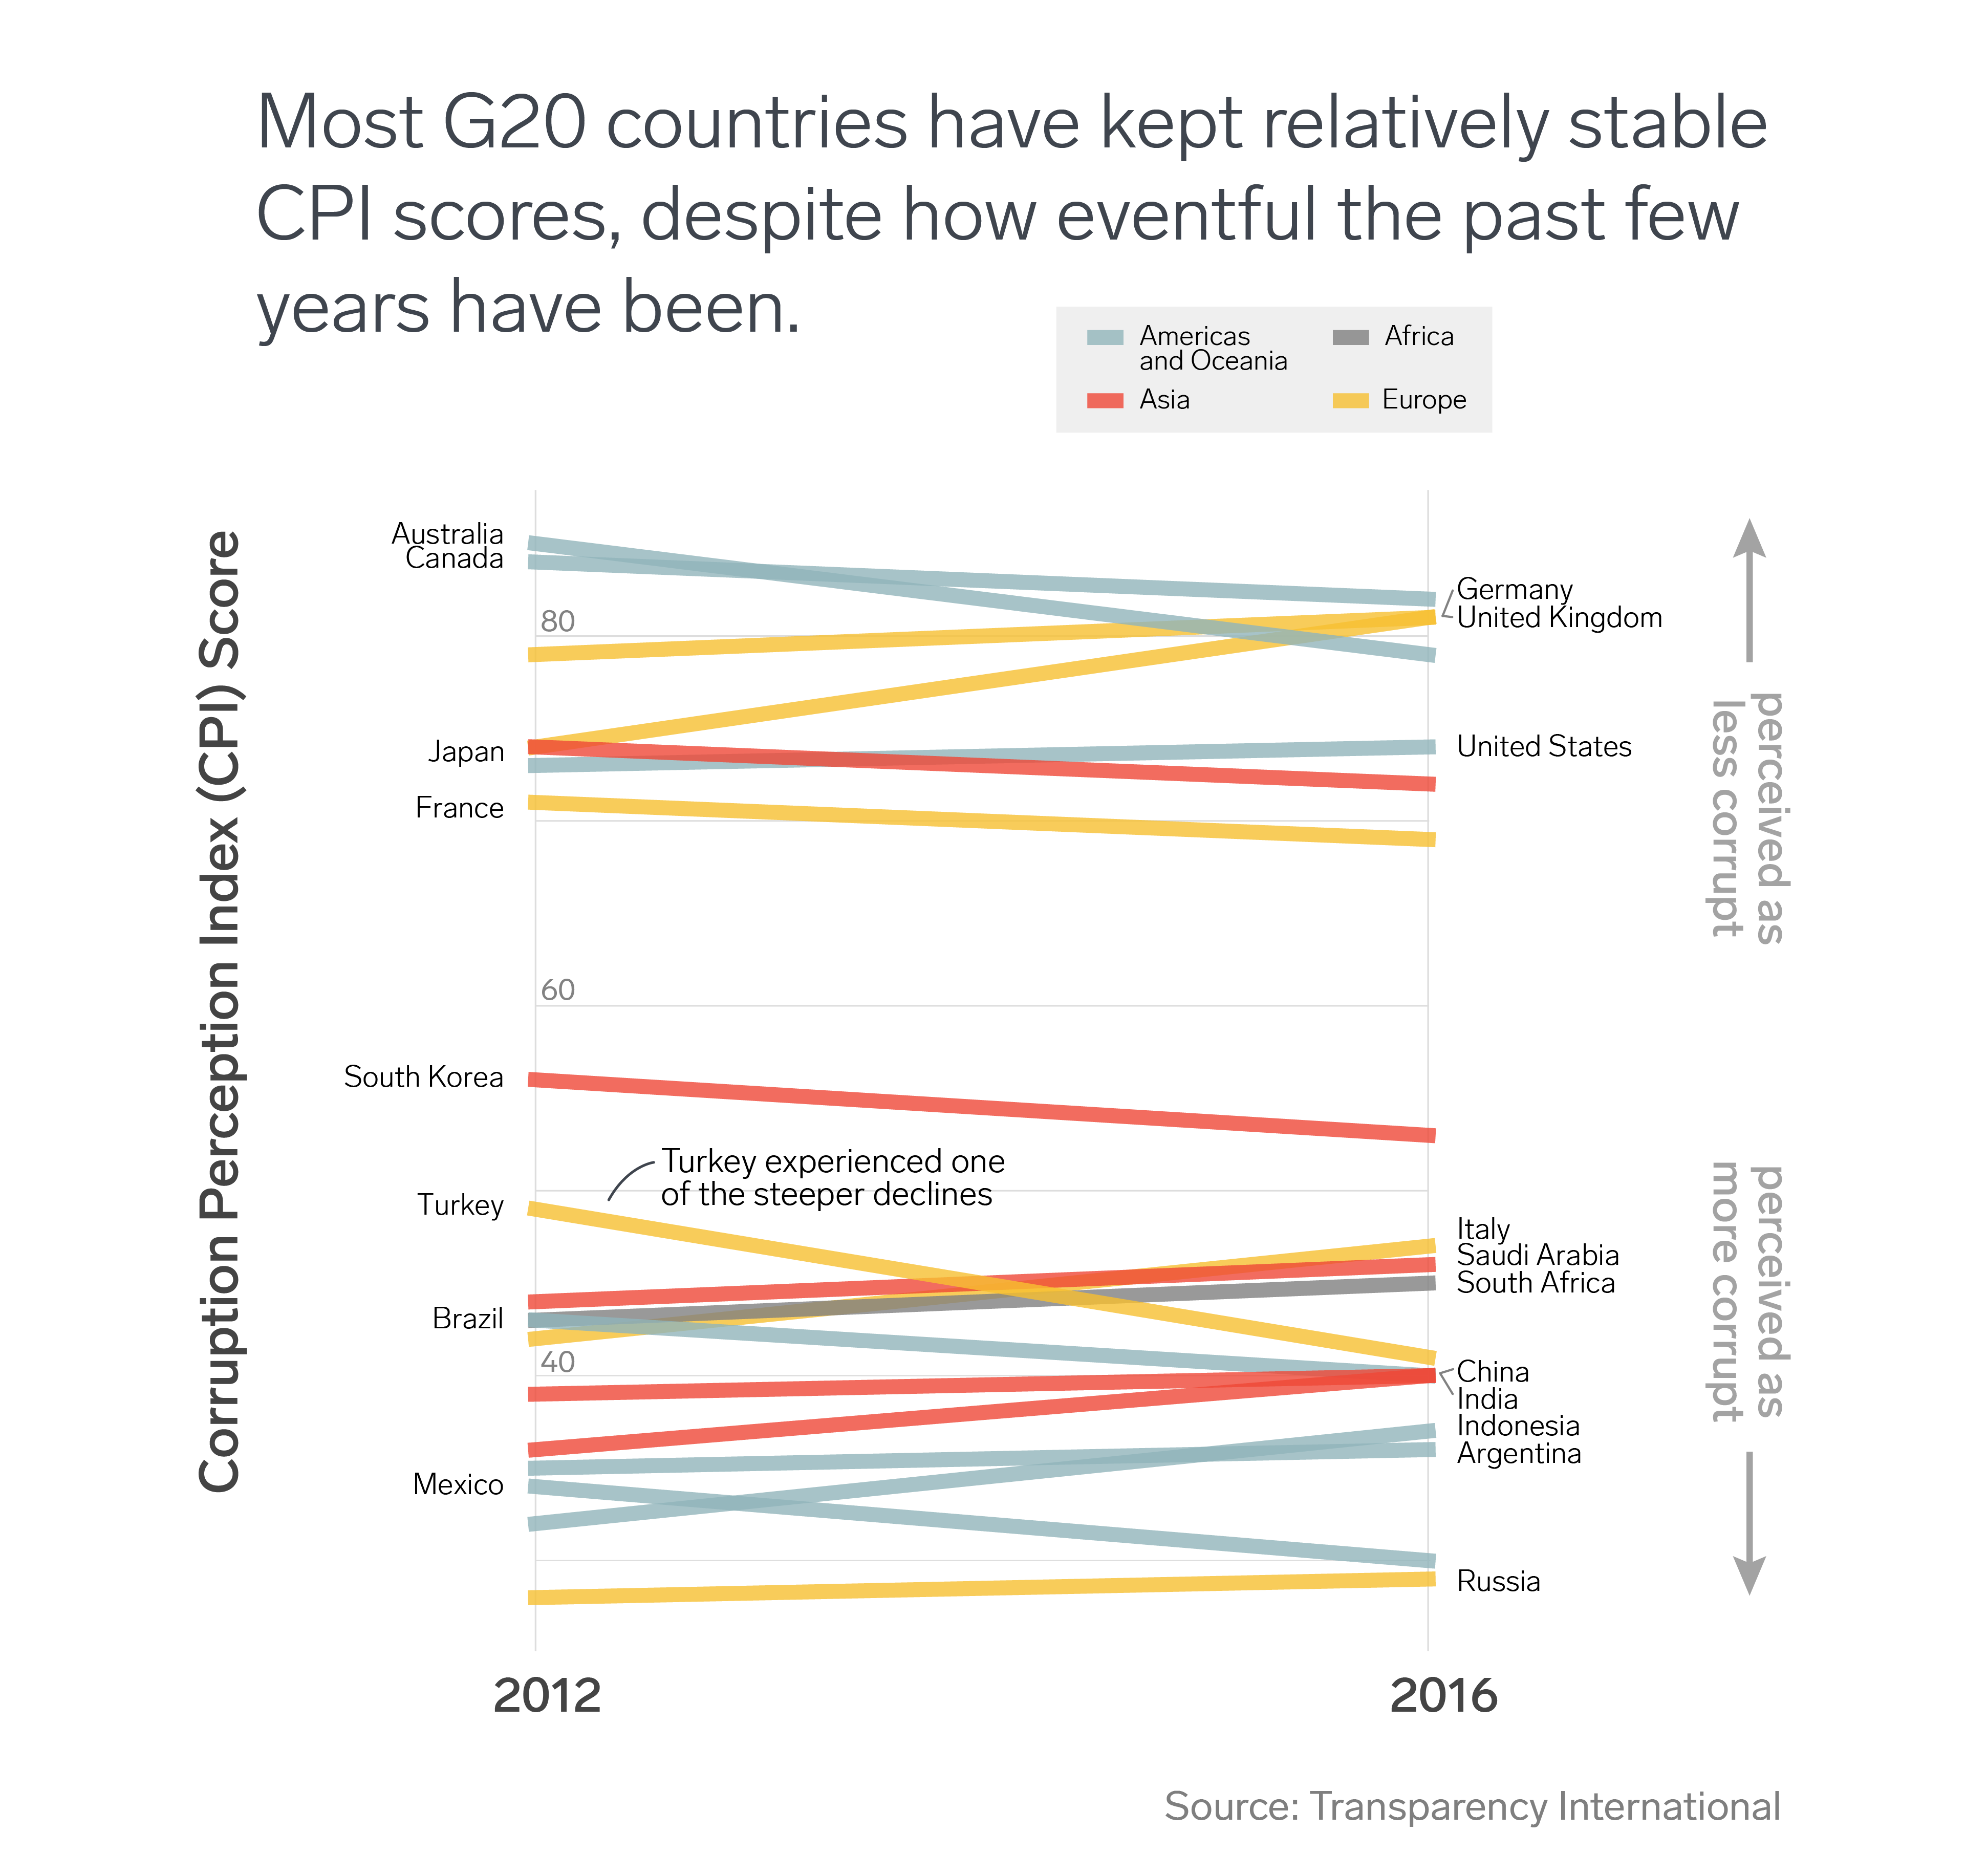
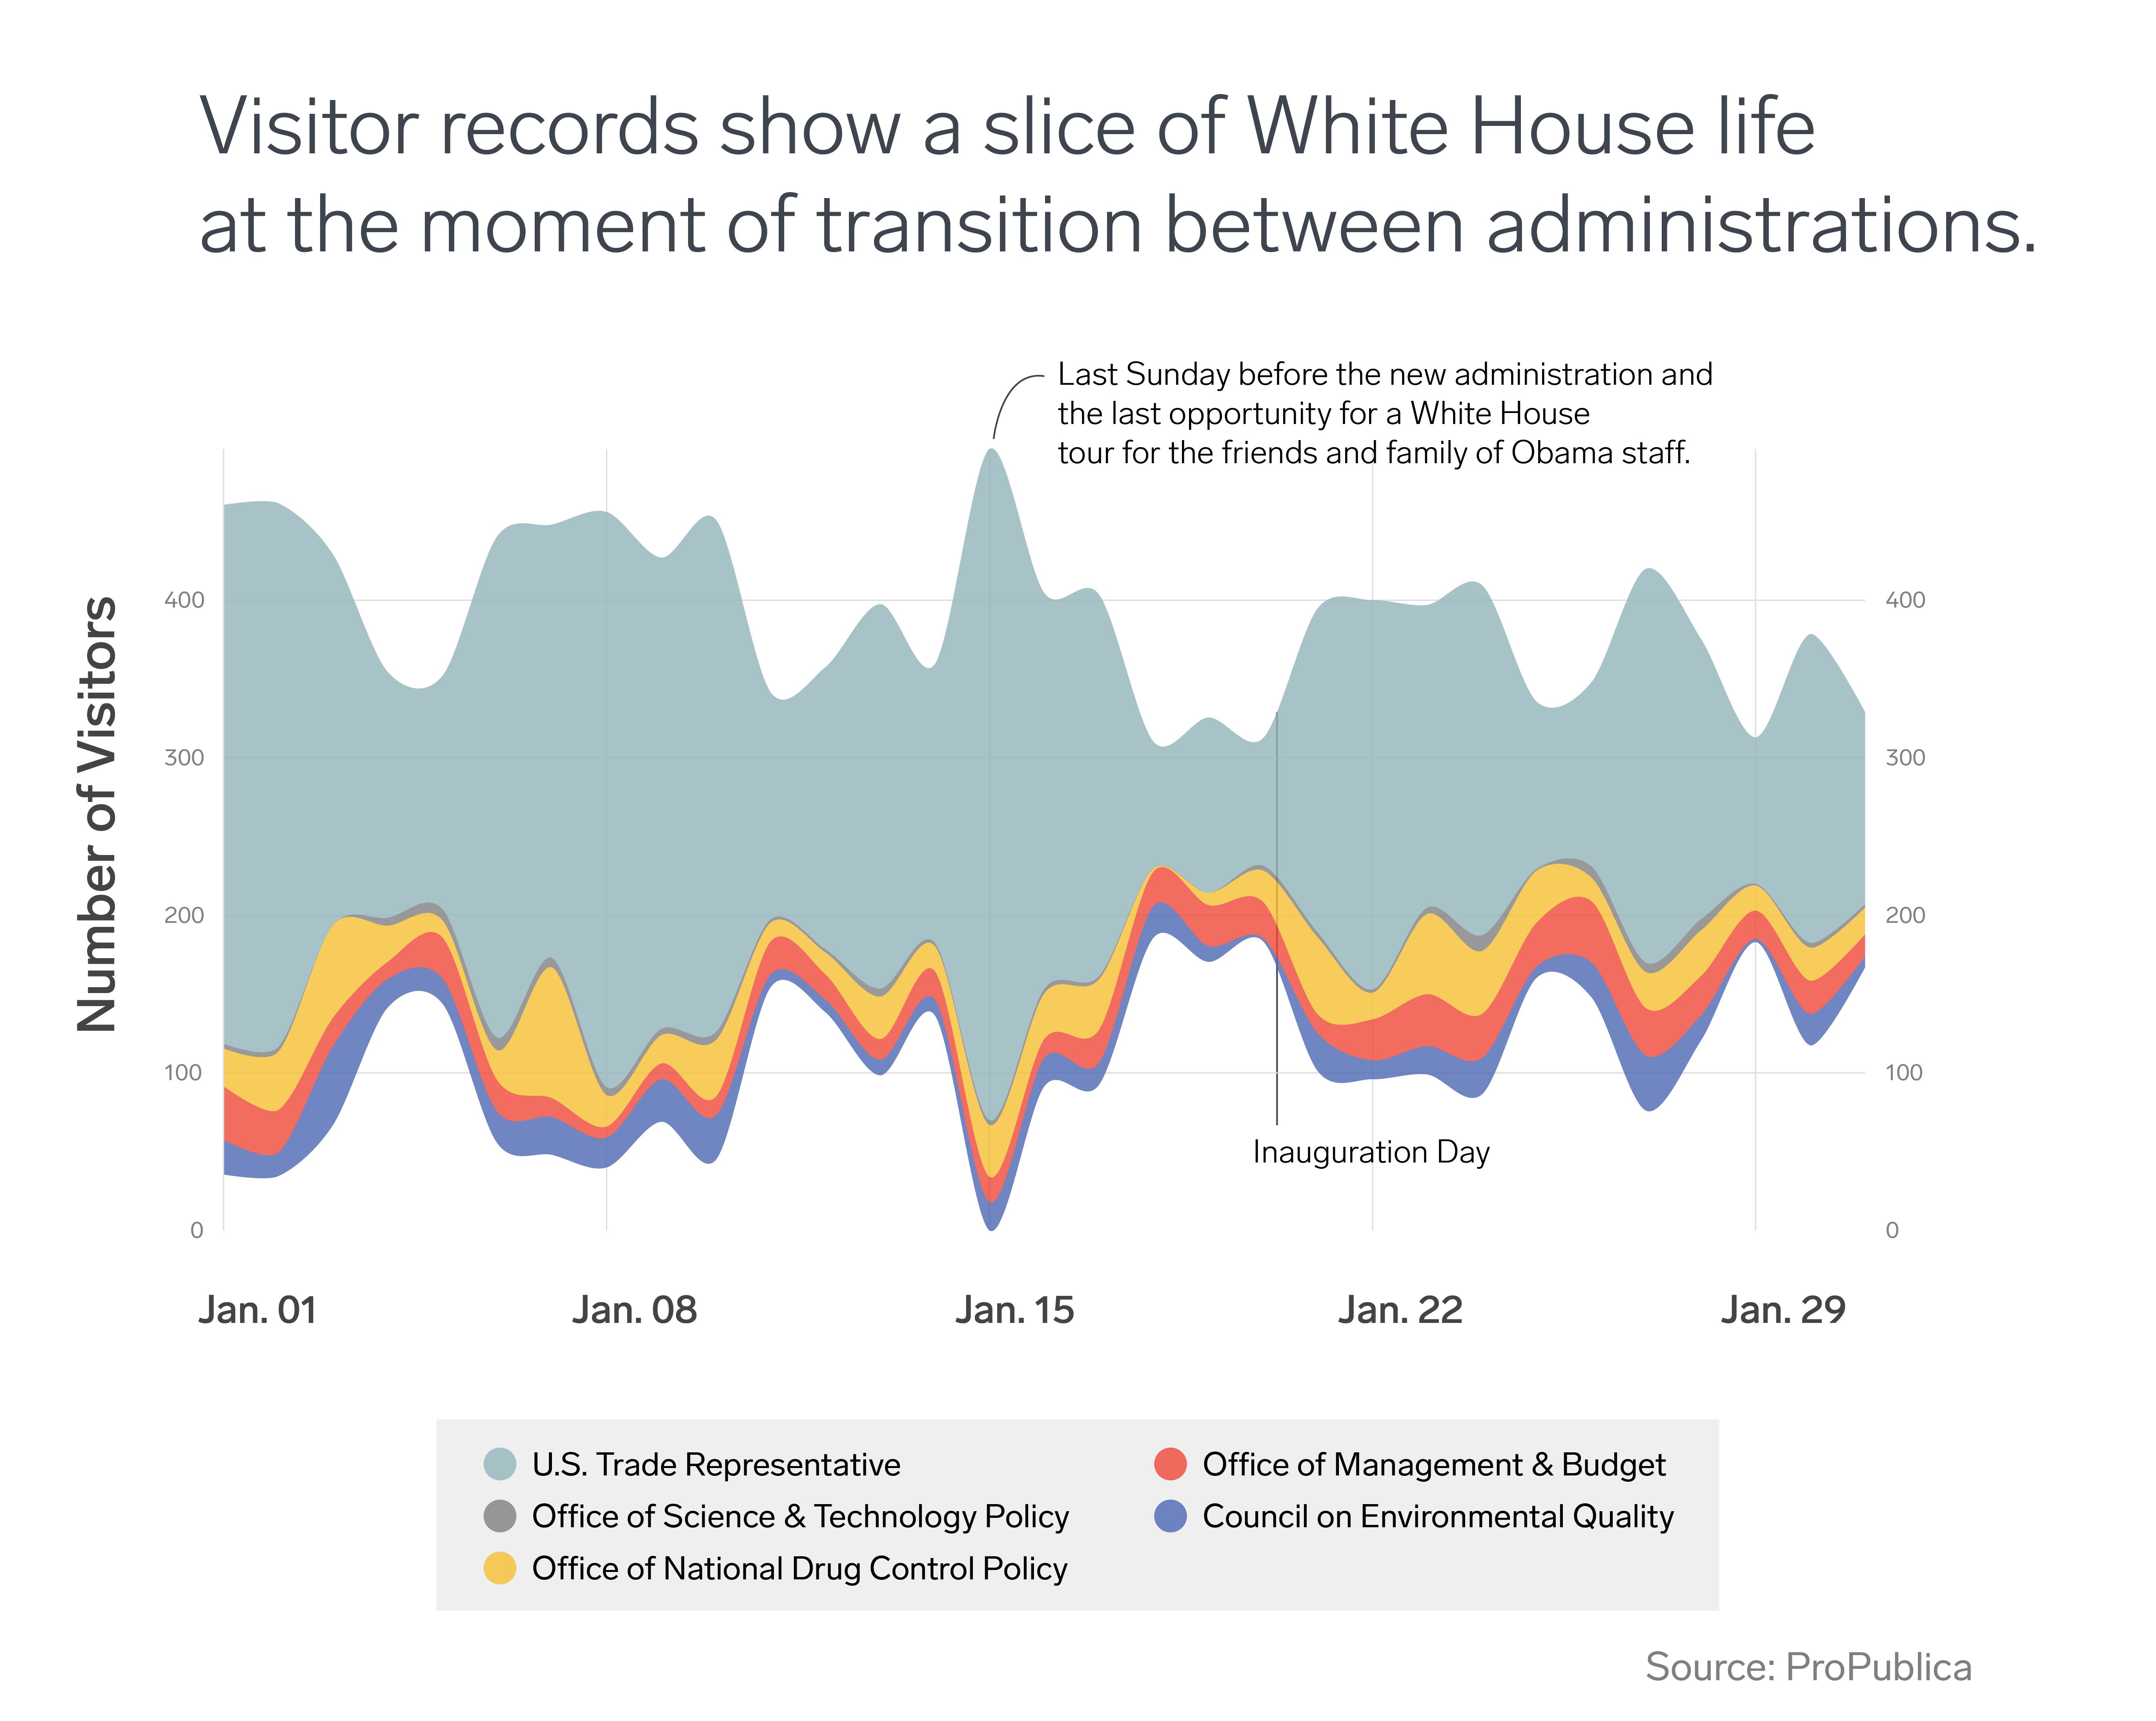
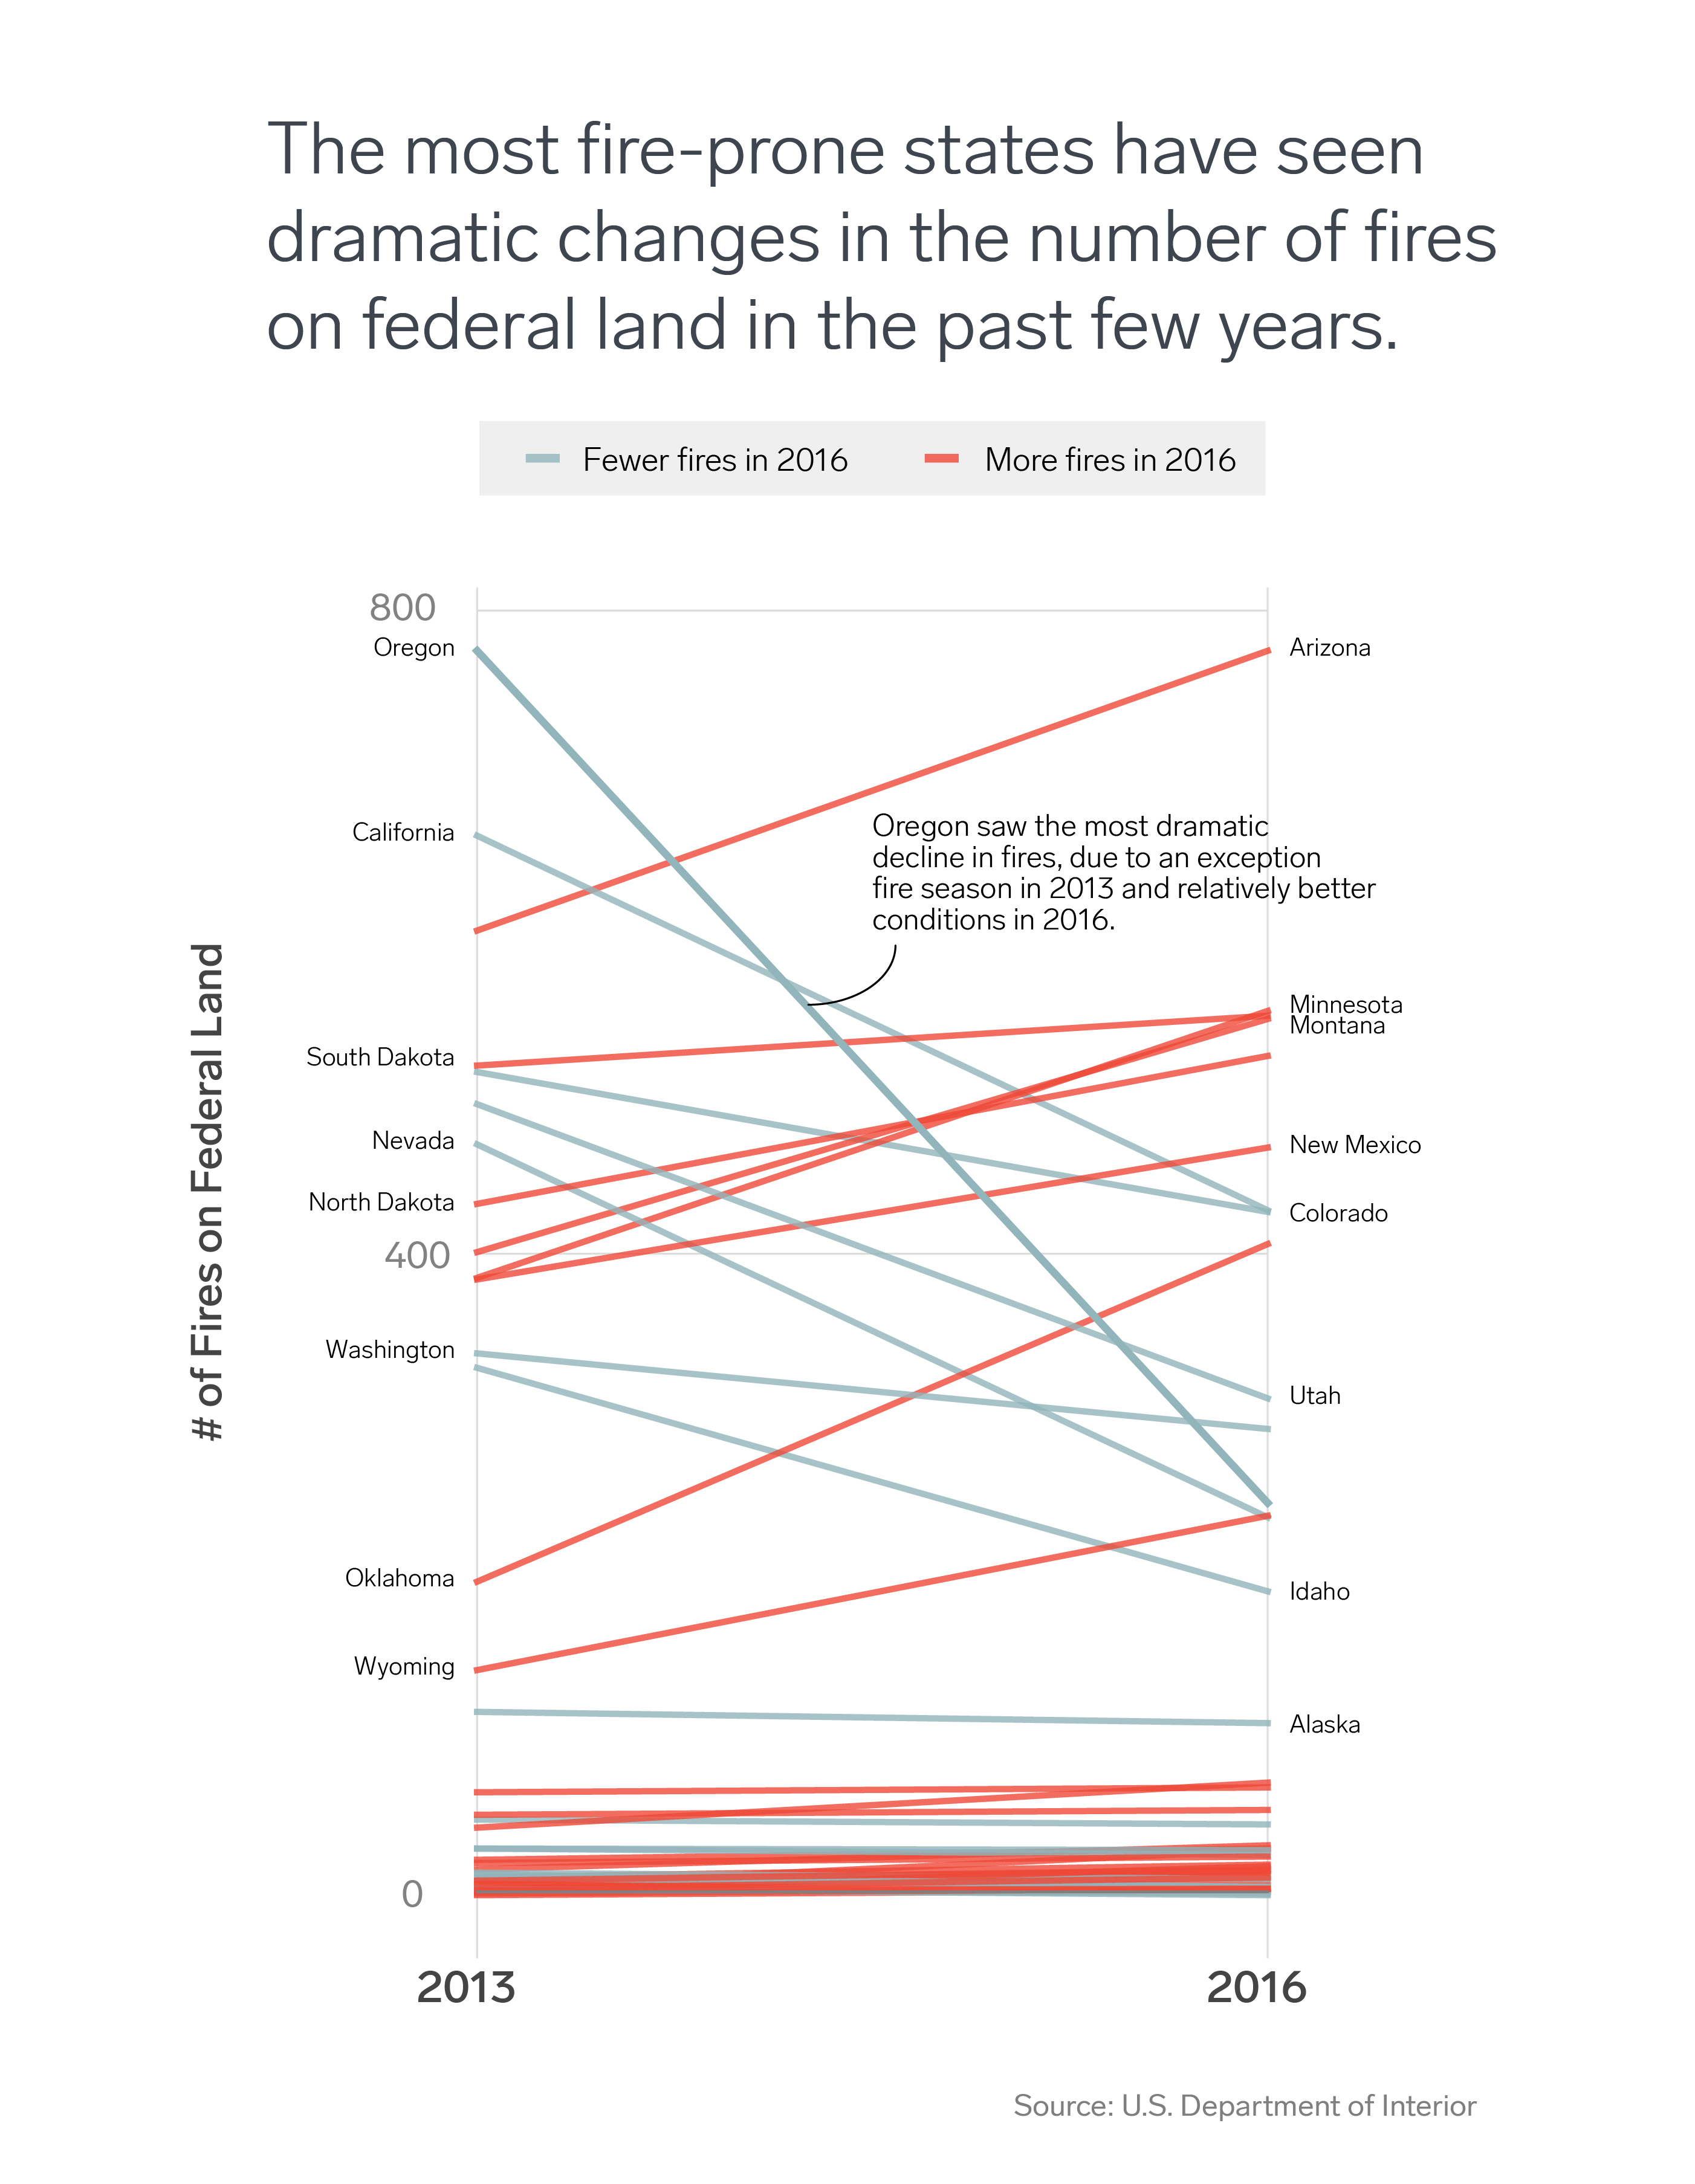
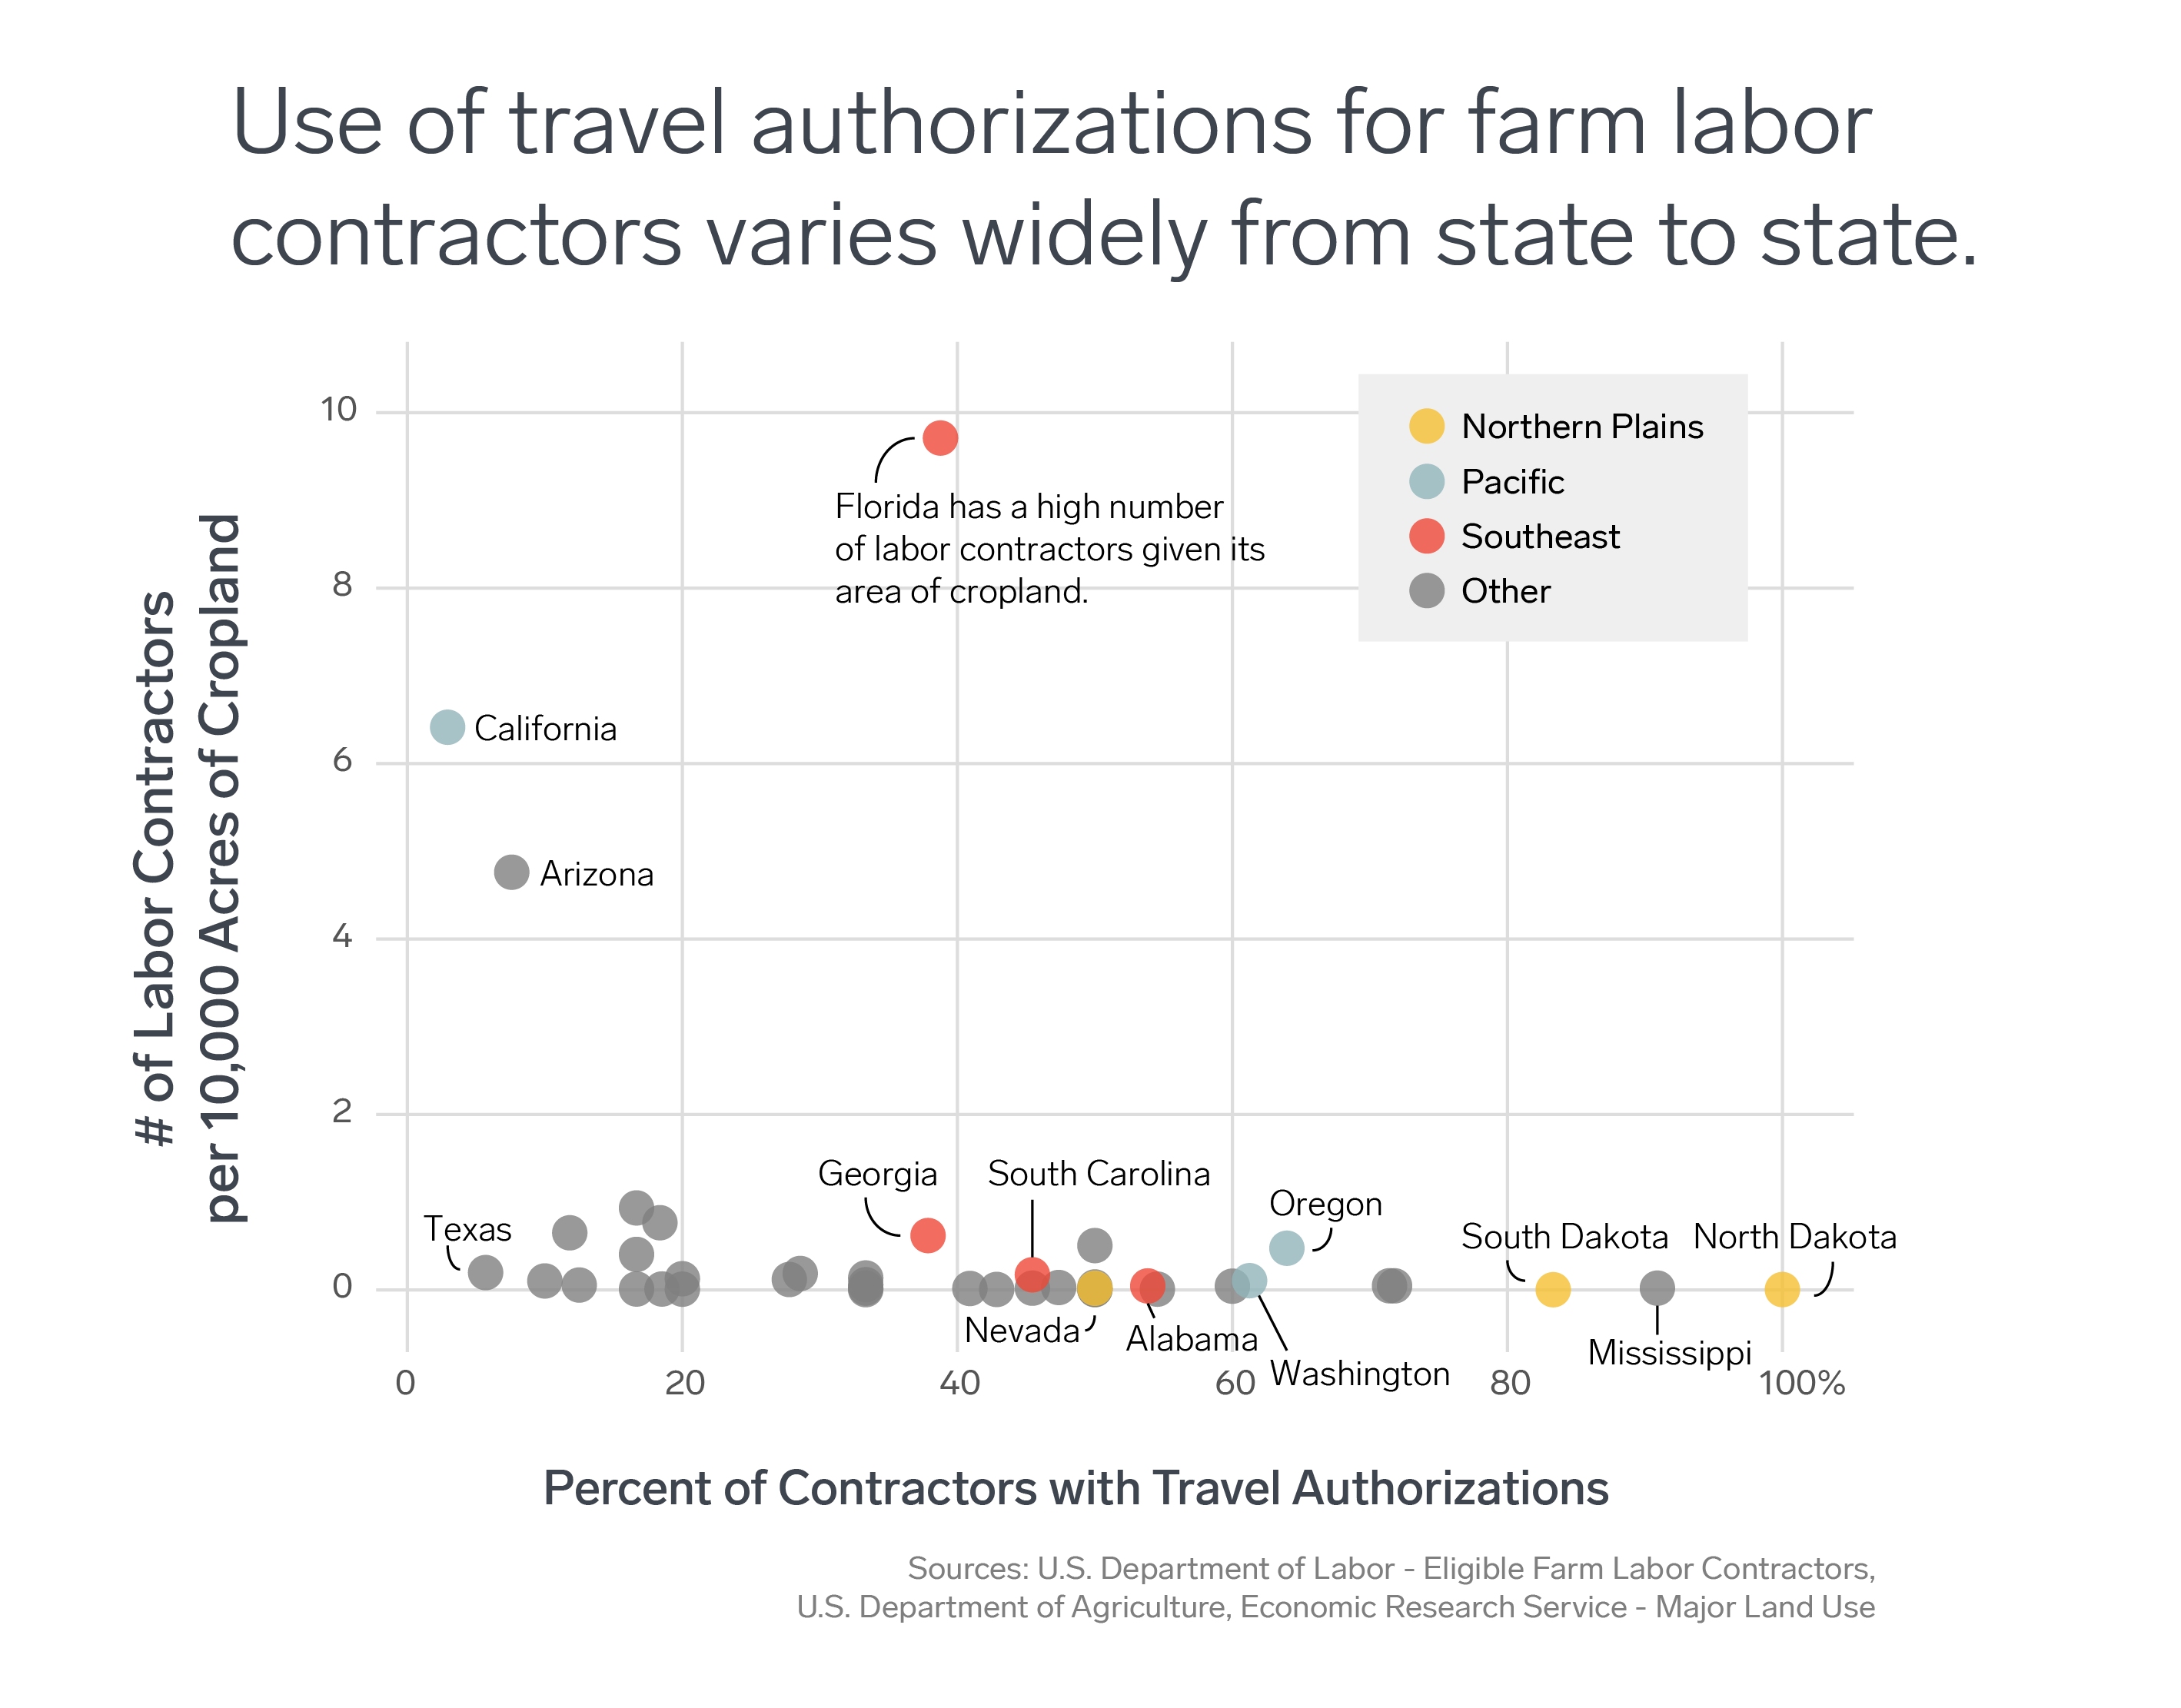
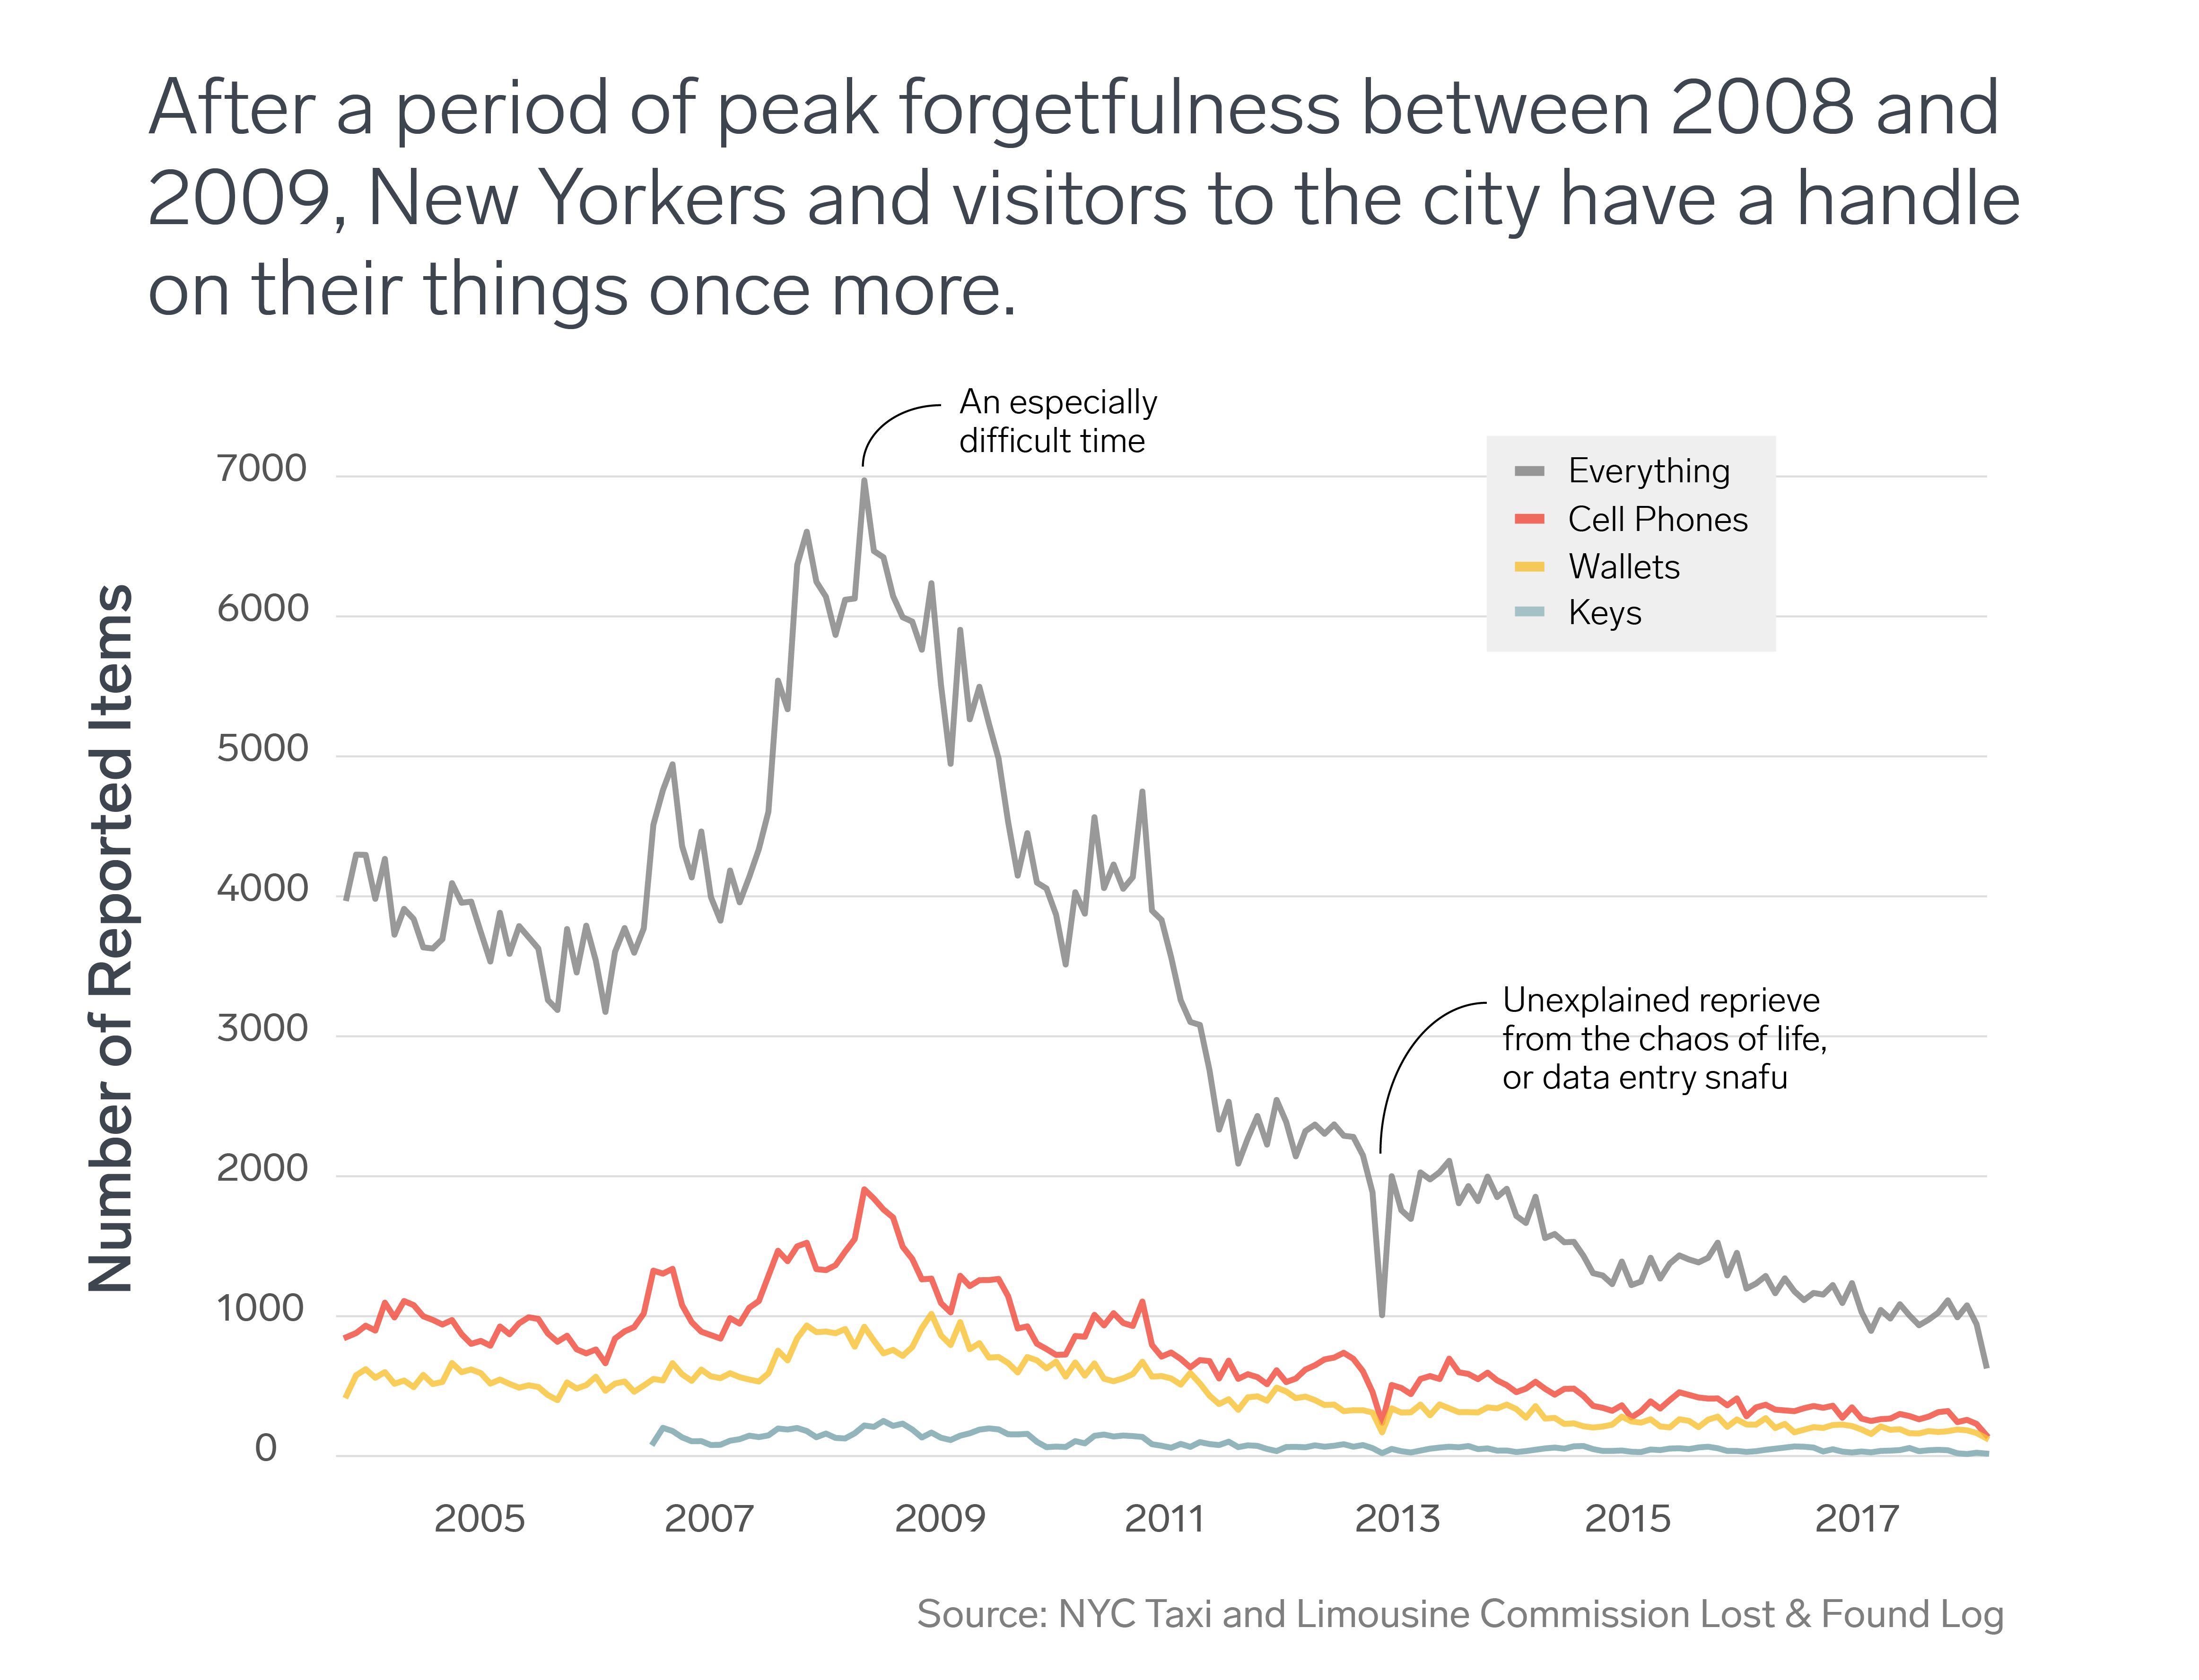
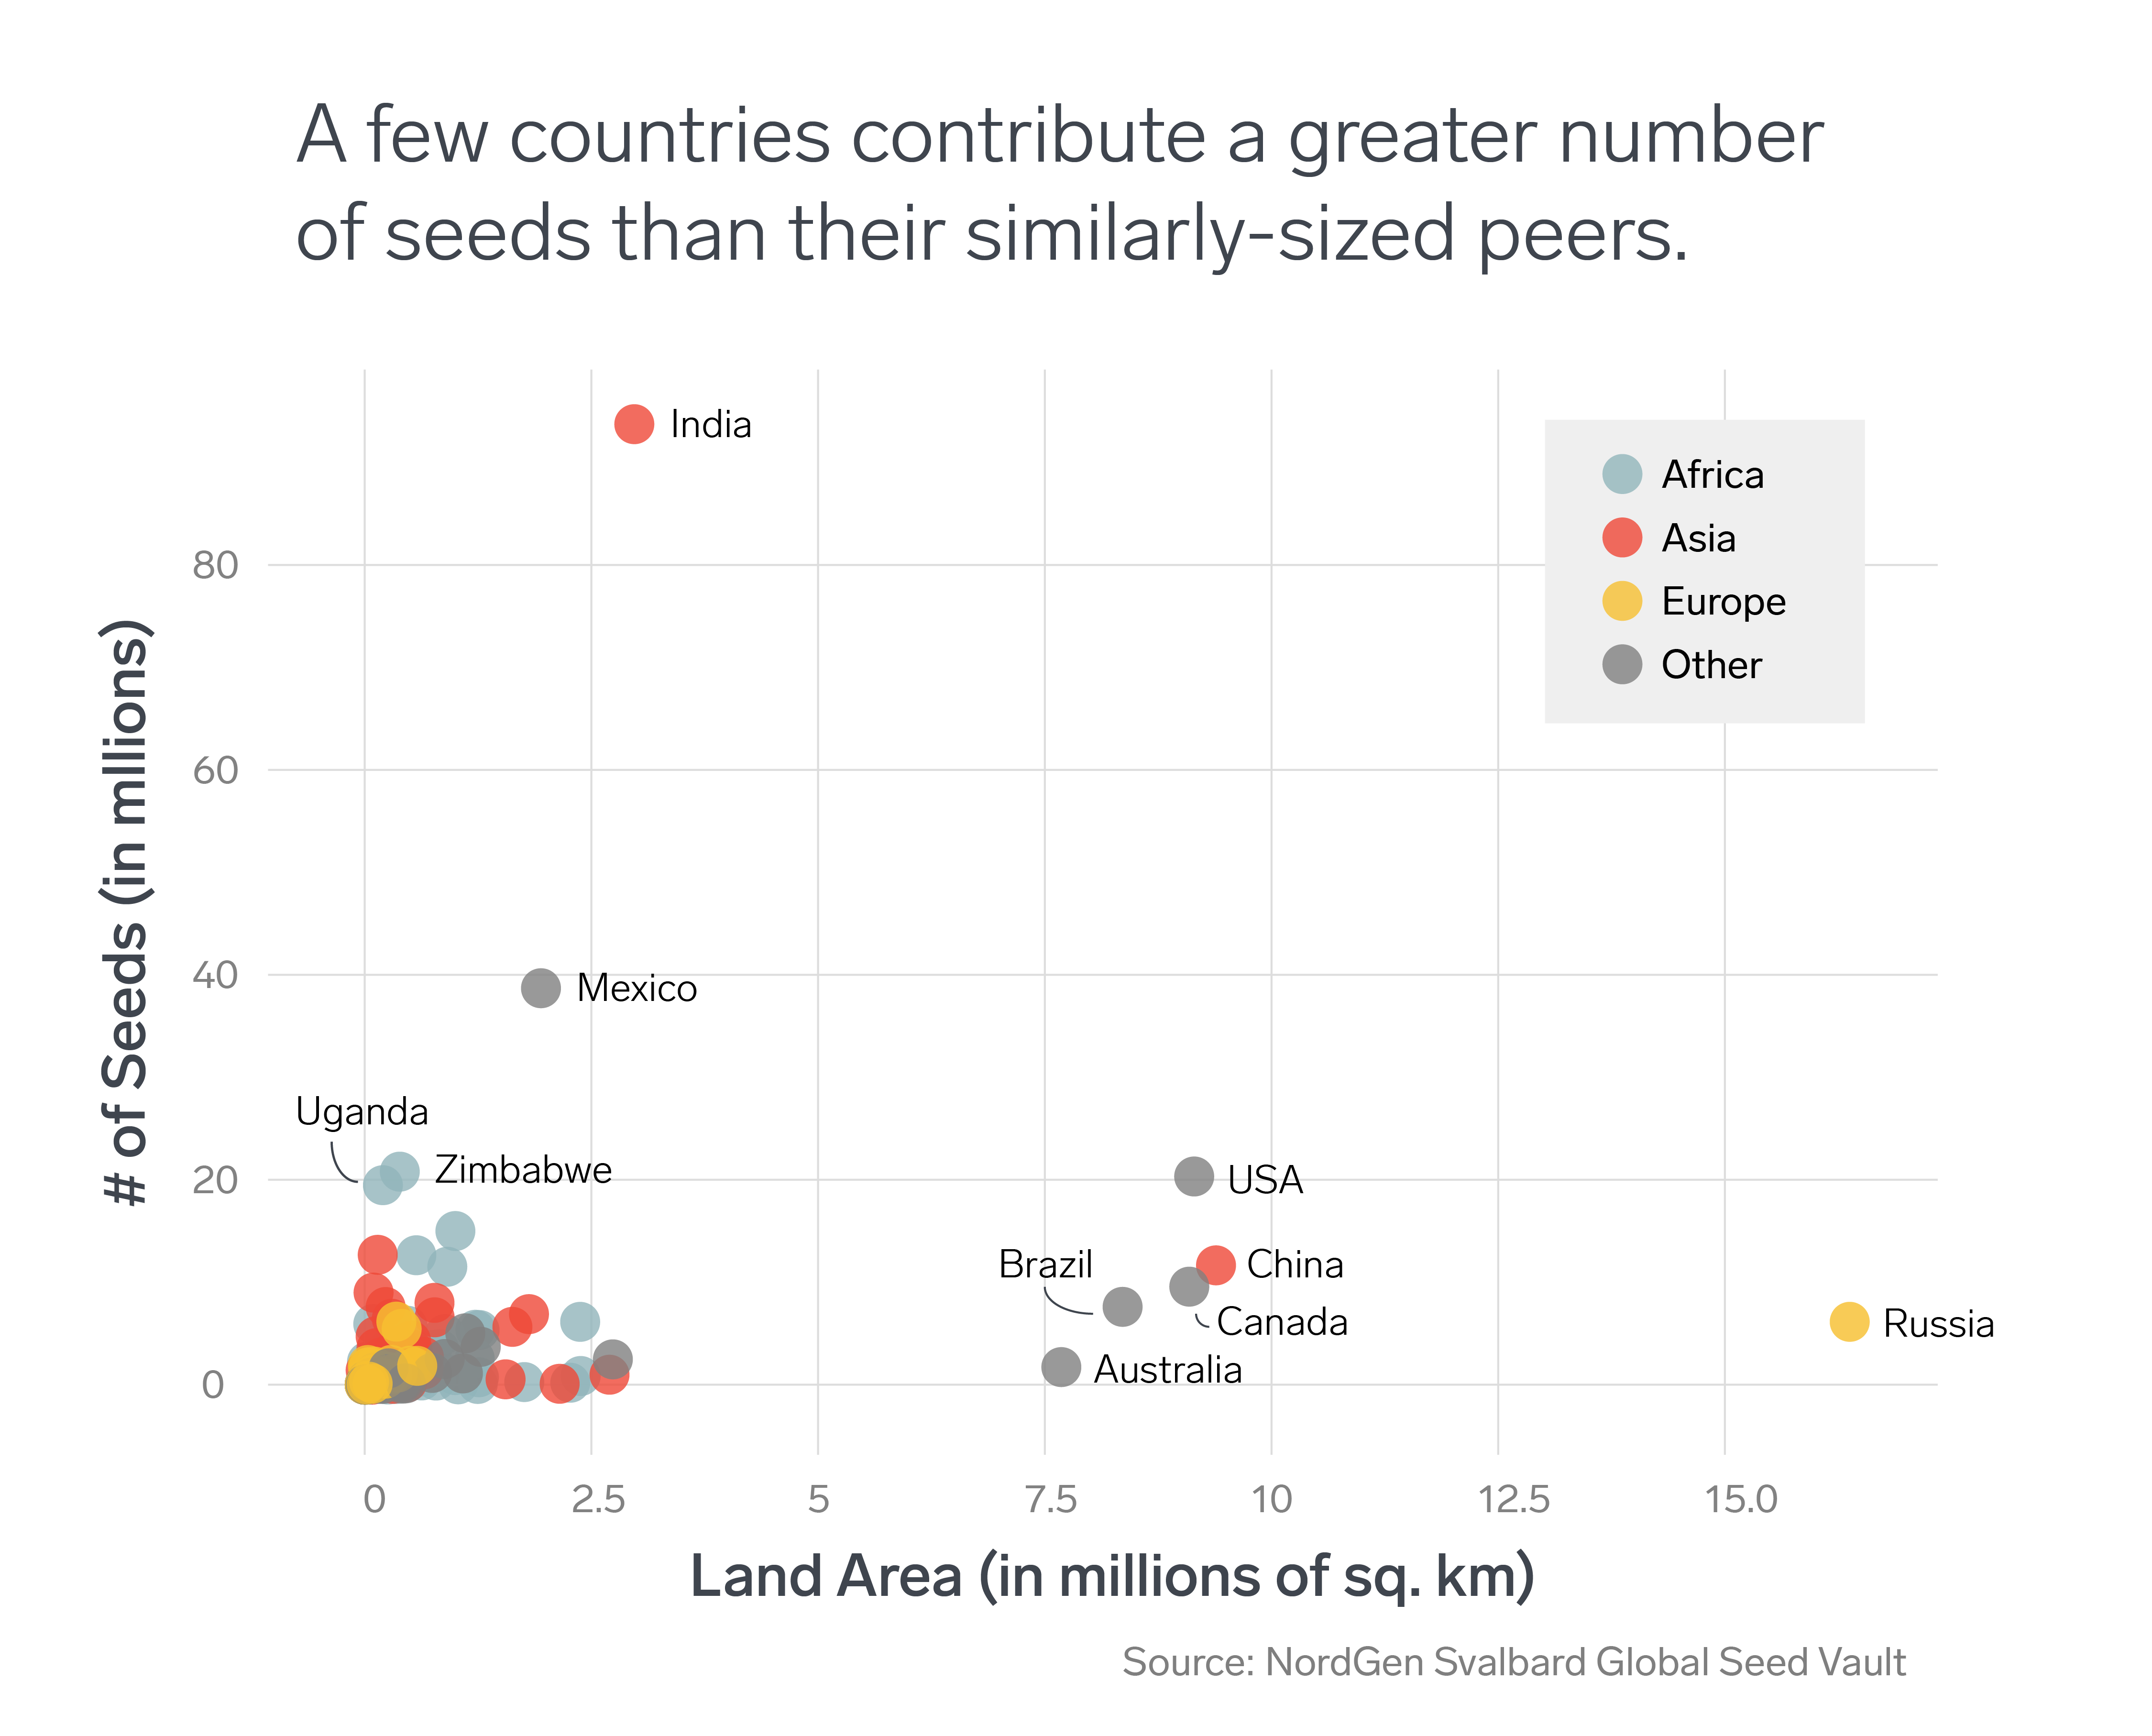
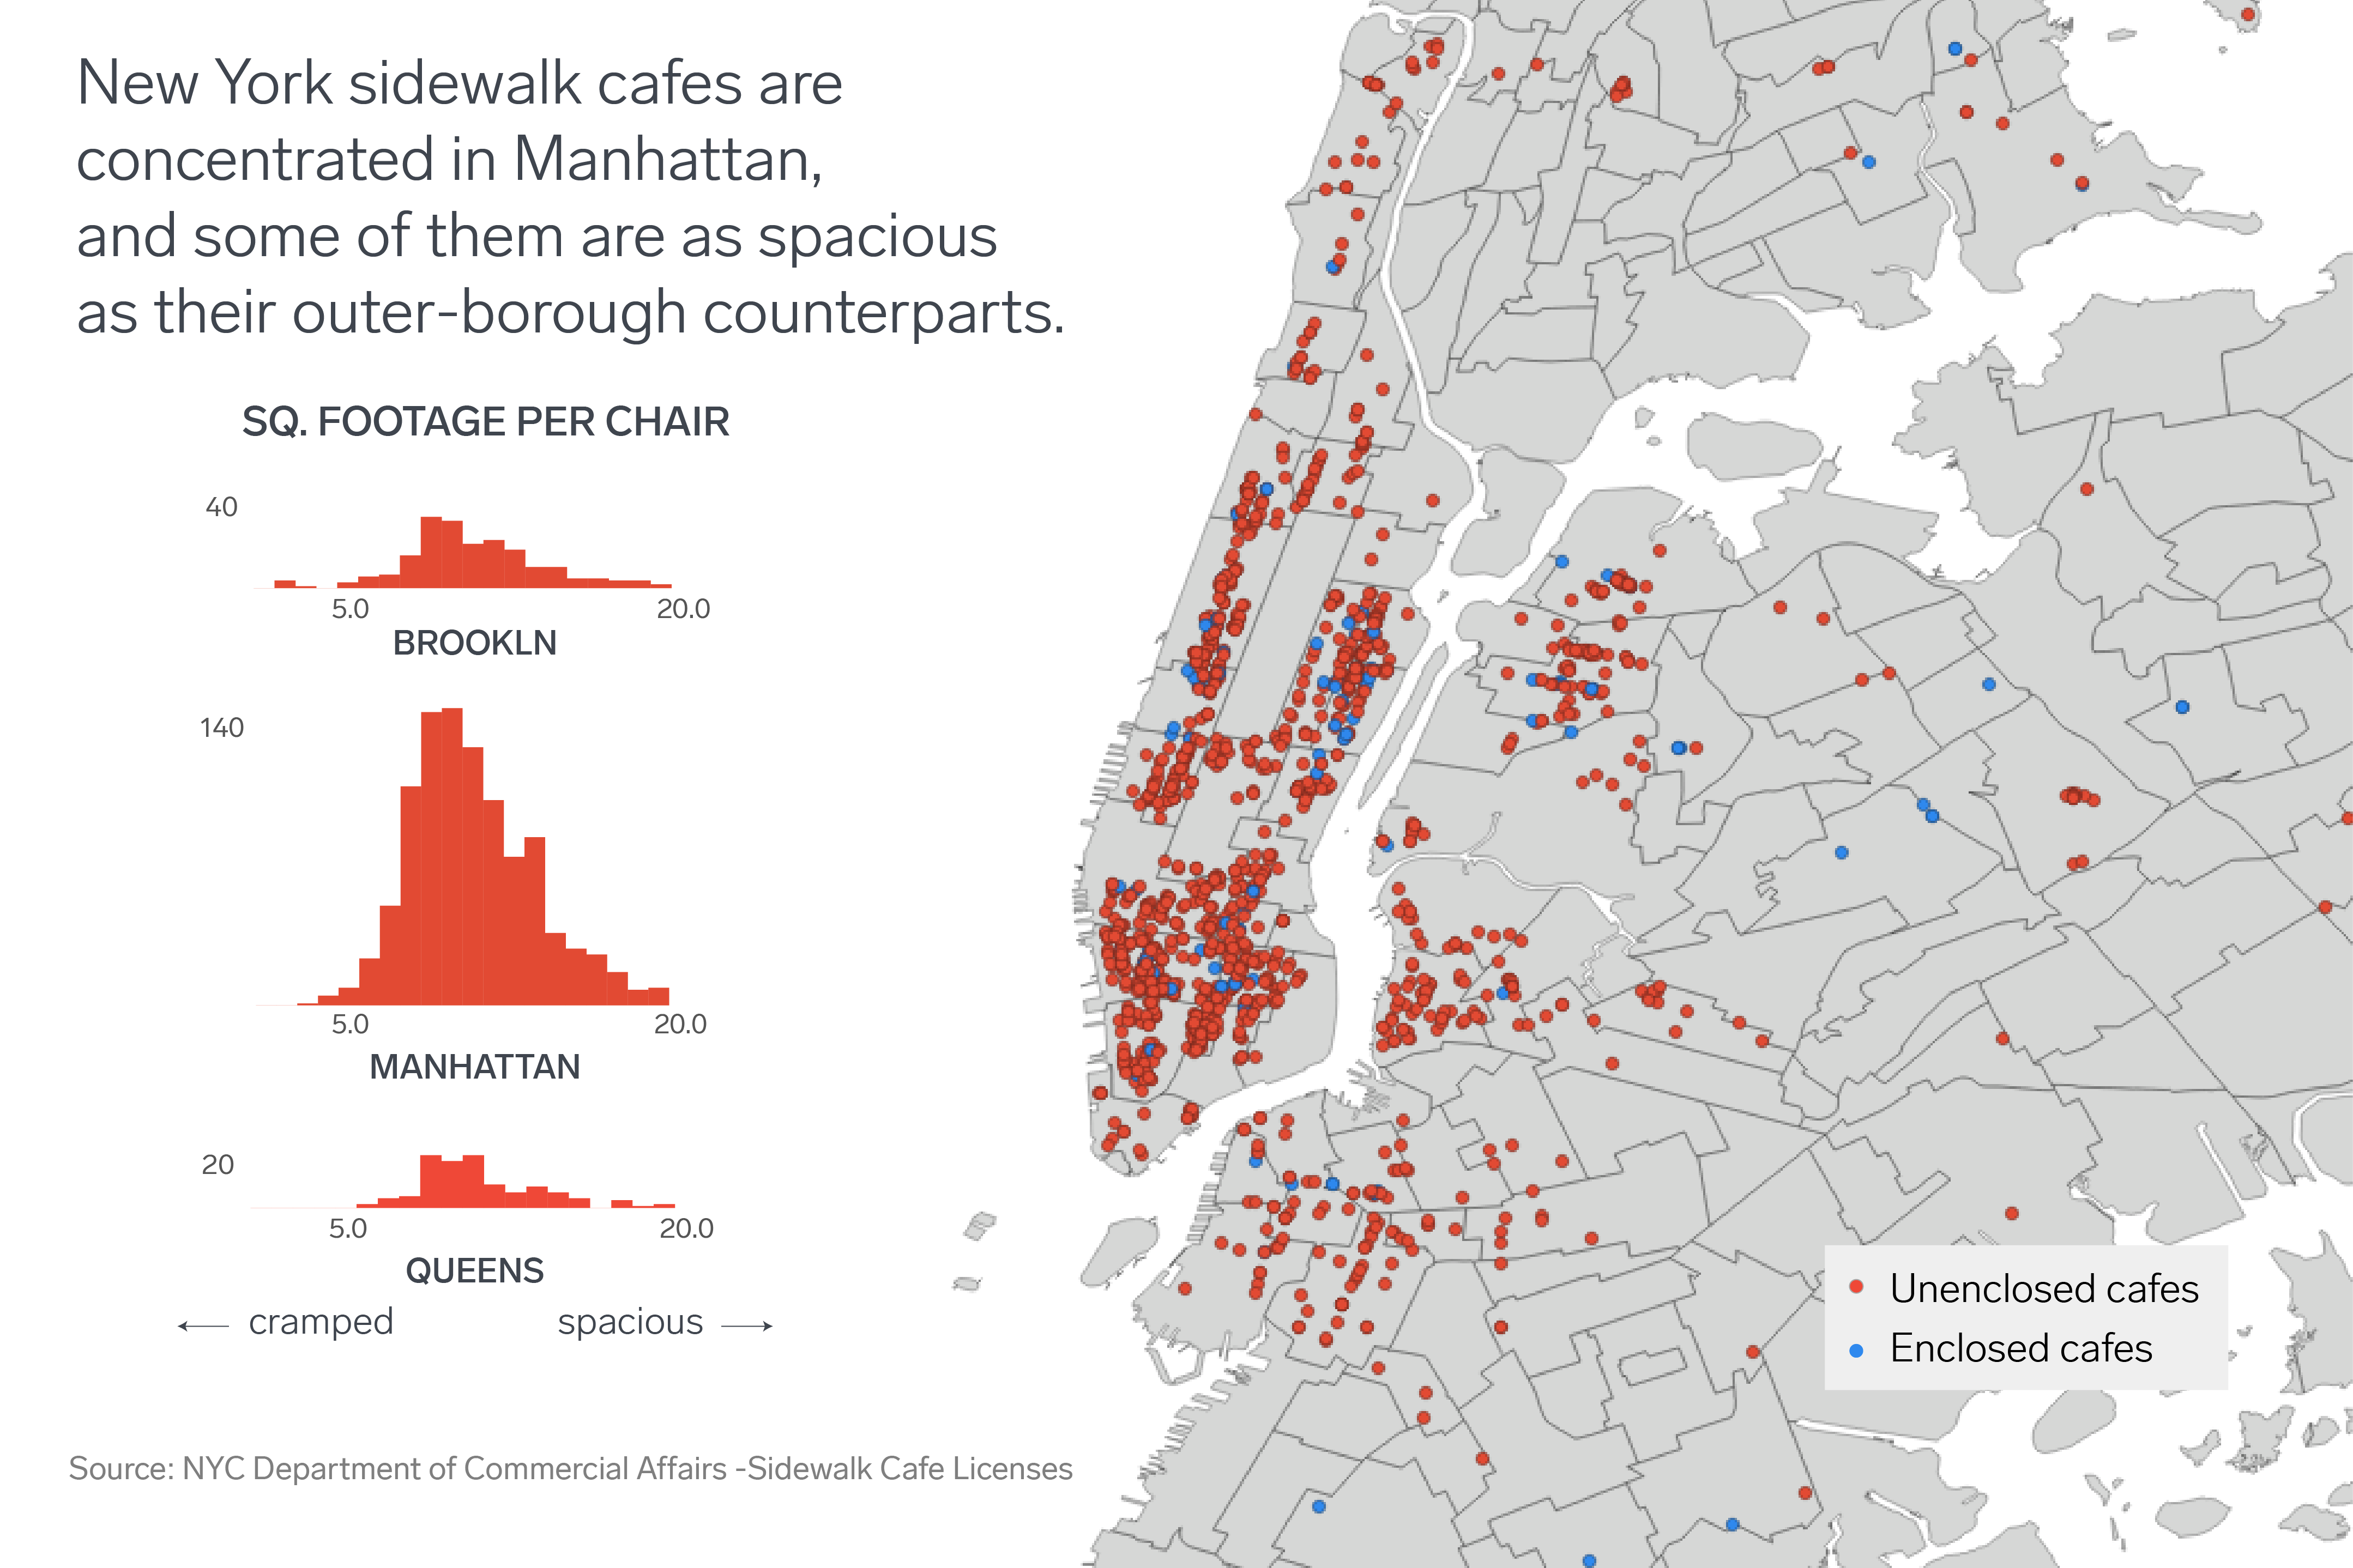
As a part of my role at Enigma, I produced one-off, primarily static graphics for their monthly newsletter. The graphic would typically be accompanied by a blurb written by colleague, who sometimes nodded to something in the chart or otherwise, just described what one could find in the dataset. A selection of those graphics can be seen below: