A theme that has come up over the course of our class is the relationship between time, speed, and space. To understand time, one must begin to grapple with what it means to be far away, what it means to move faster relative to each other, and what all of that means for the here and now.
Towards that end, I wanted to develop a tool for the students at the Lower East Side Girls Club to engage with the planetarium and the planeterium software, Open Space.
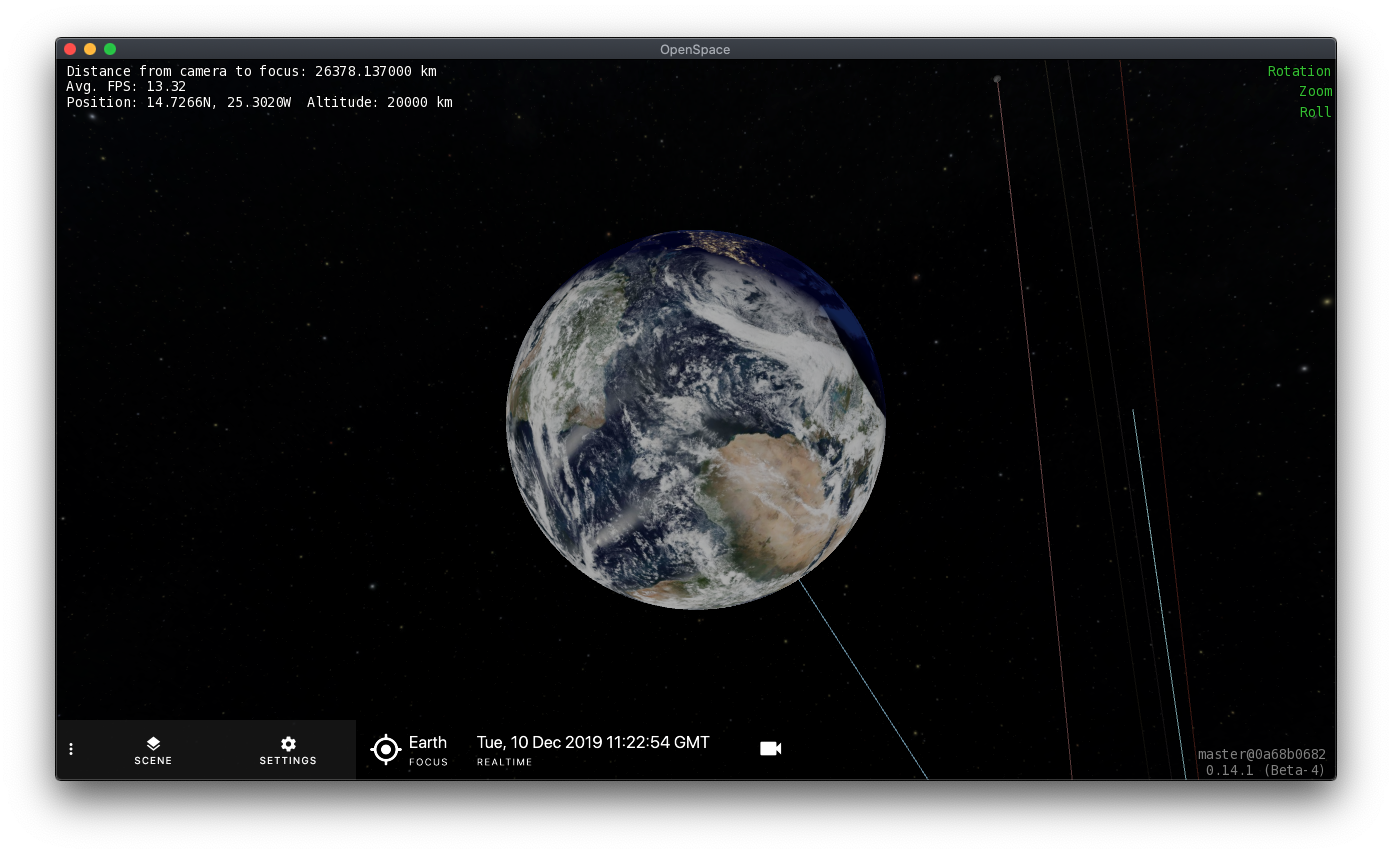
Open Space is already a powerful tool for visualizing the known universe. For the students at LES Girls Club, I wanted to create an interface through which they could travel through time and space while constructing their own narrative. To develop this project, I tasked the girls with developing their own planetarium show by selecting a number of stops in the solar system and pairing those stops with some sort of researched fact.
One of the girls took to the assignment beautiful: she created a “roast tour” of the solar system, in which she leverage scientific facts about various planets and moons and poked fun at their expense.
In other words, it was the perfect planetarium show.
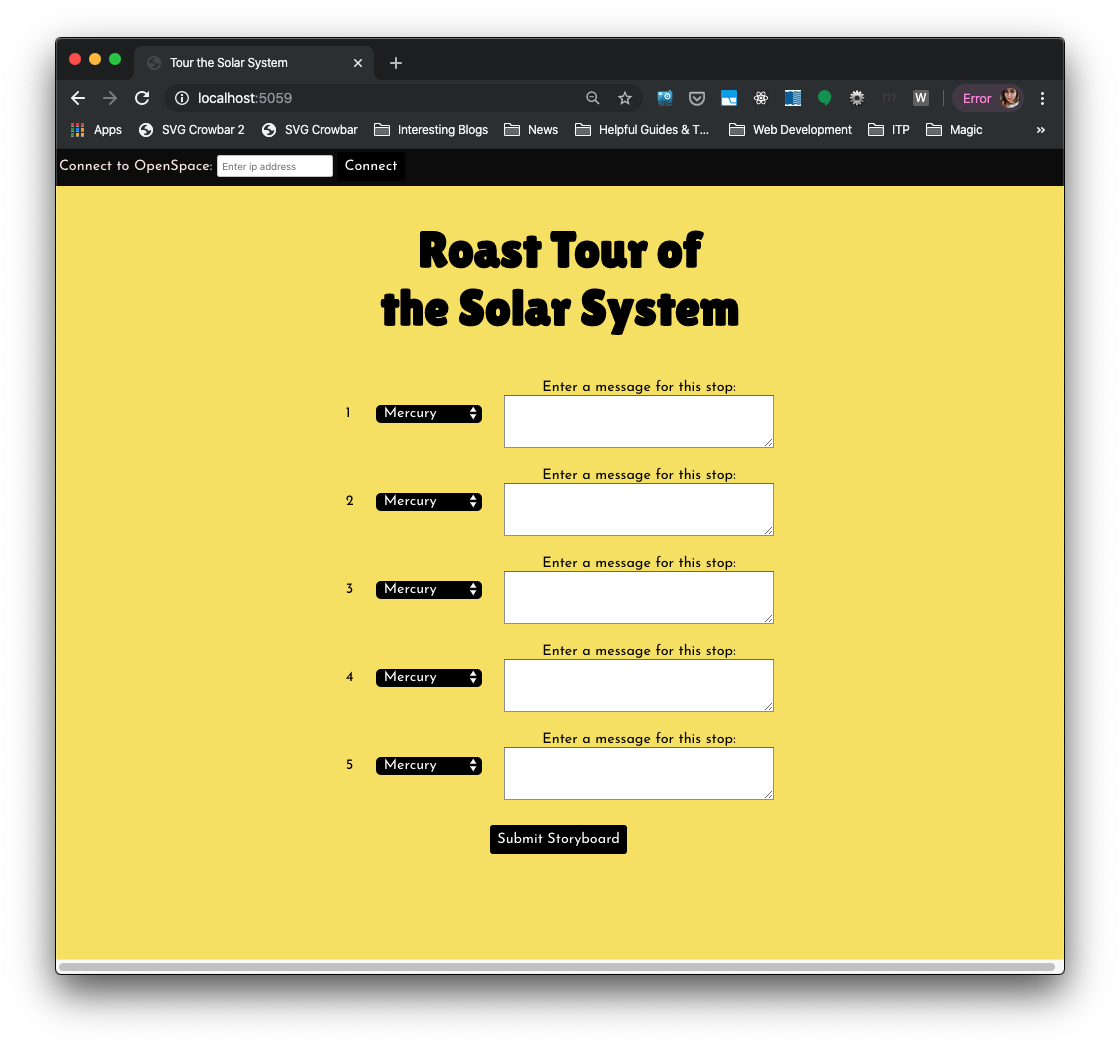
Inspired by this response, I created an web interface for planning such a show and presenting it alongside a projection of Open Space. To use this interface, the girls would open up Open Space on our project, while running the web interface on the same machine. They would then storyboard a series of stops and roasts to plan their show:
Next, they would move through their submitted storyboard using the following page:
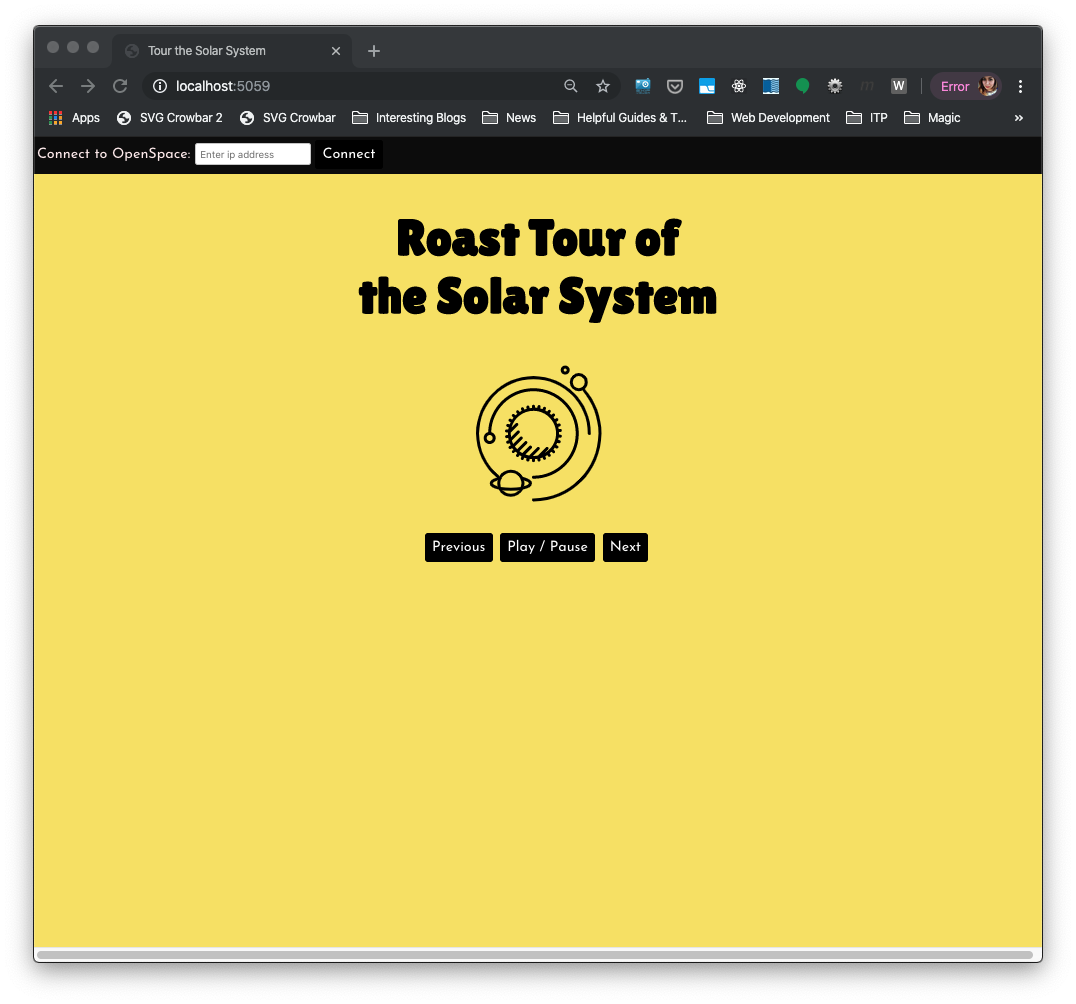
While they moved through the stops in their show, they could use the native Open Space controllers to zoom and rotate around their selected stops. As they navigate space, their “roasts” are played using web voice synthesis.
The code I wrote for this project is available here, at a fork of the Hayden Planetarium’s Open Space software.
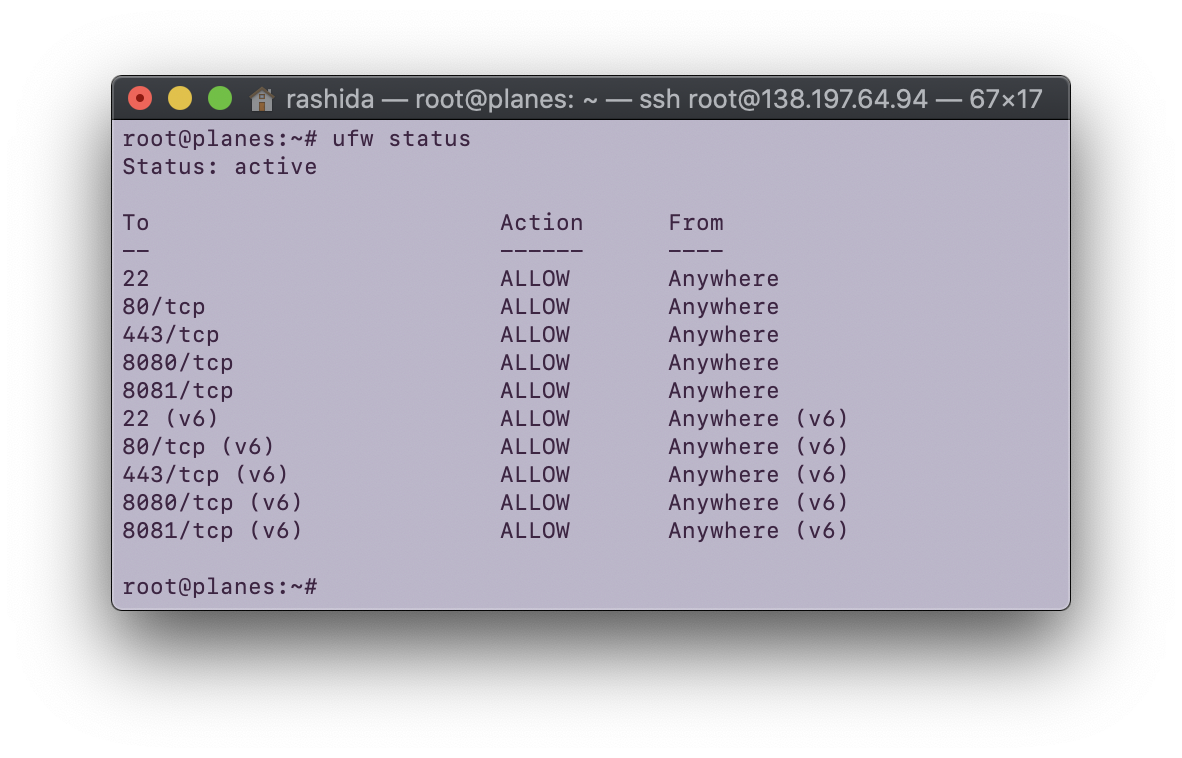
For this assignment, I added a firewall to my Digital Ocean droplet.
I analyzed my log results using python (code viewable below).
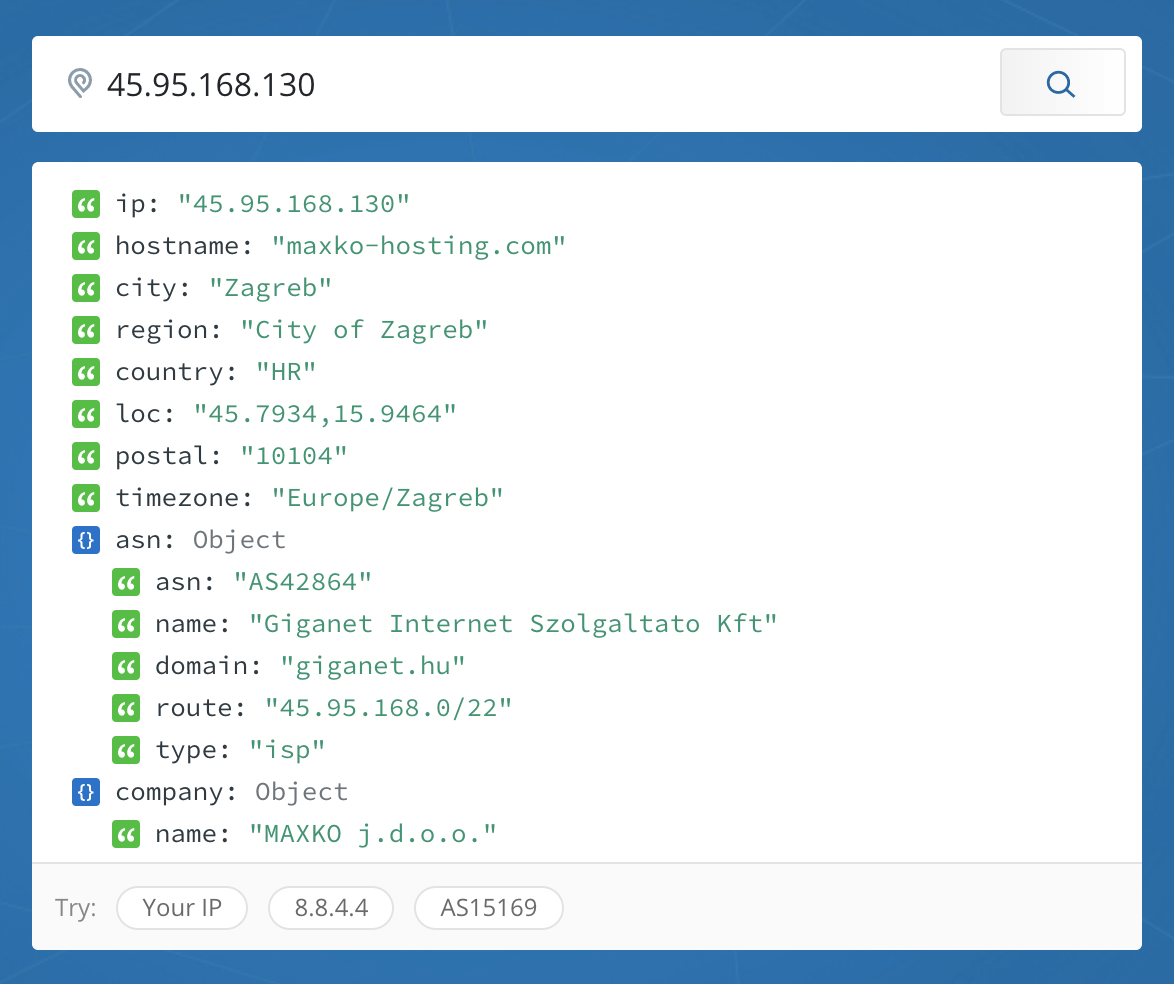
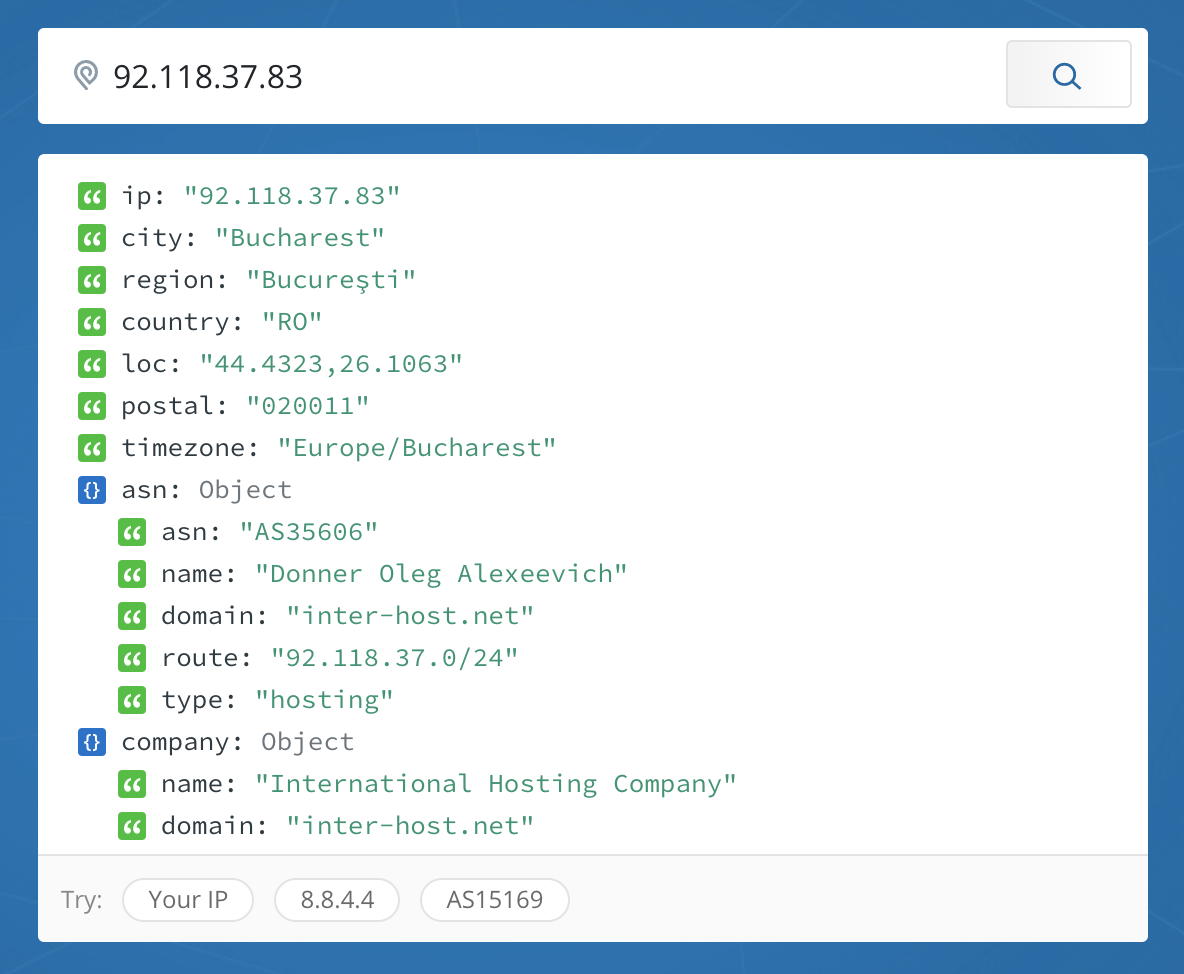
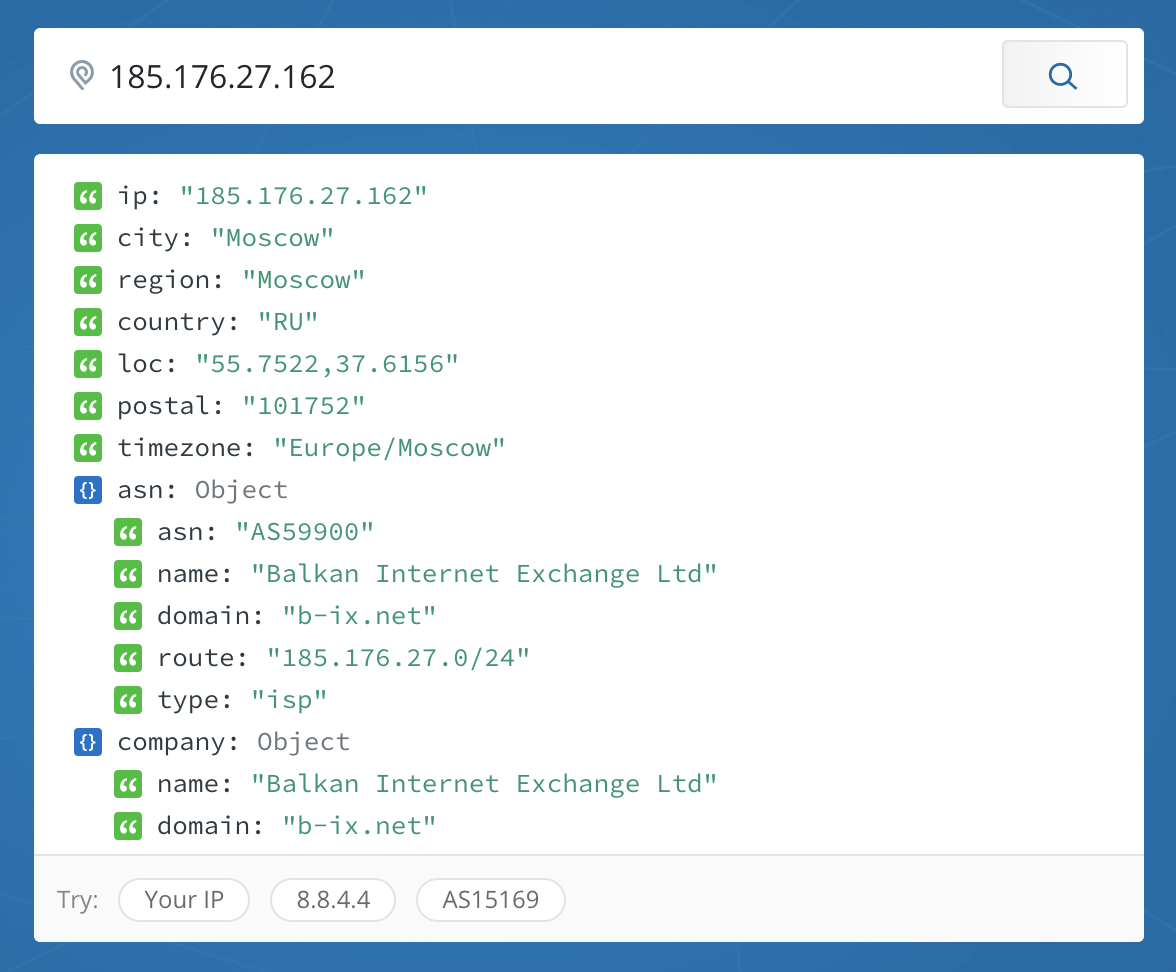
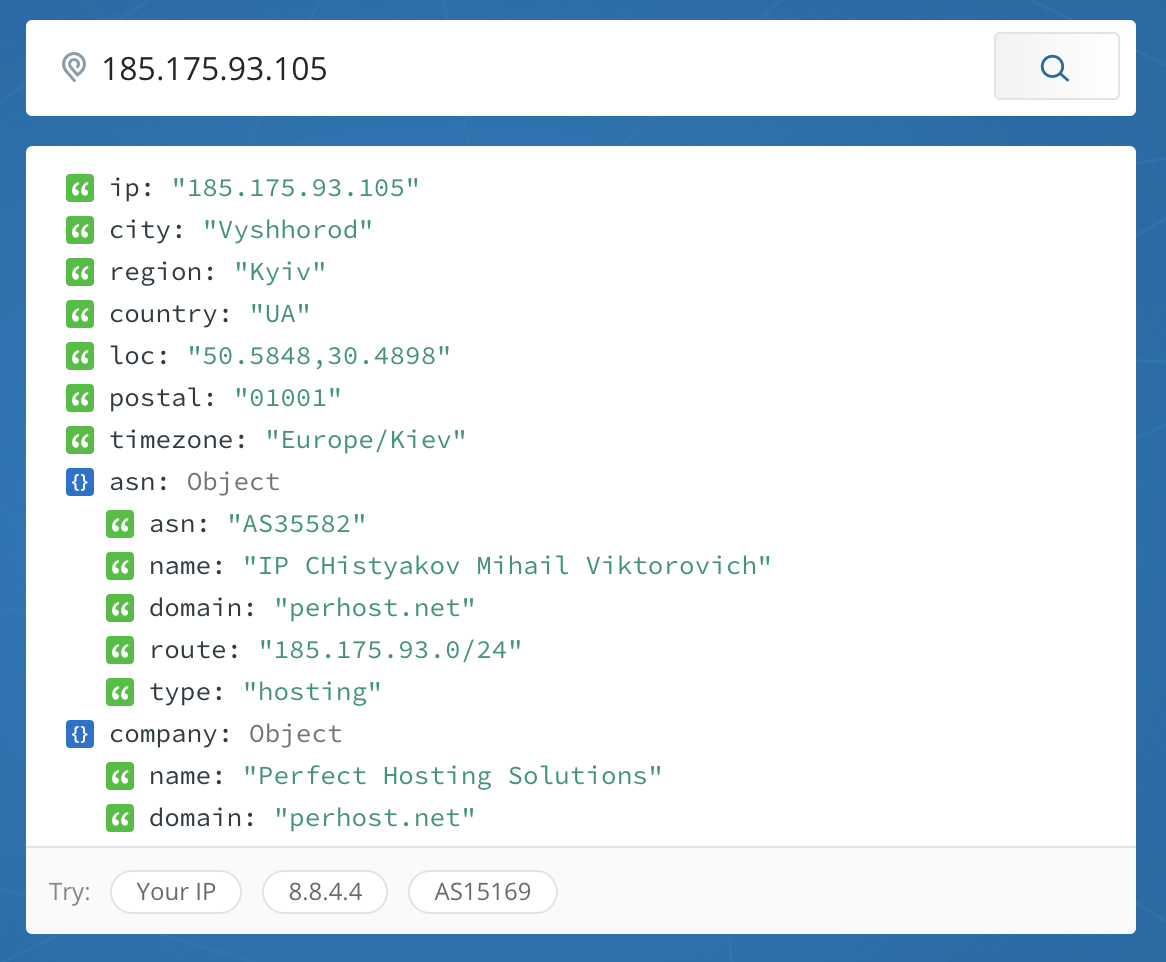
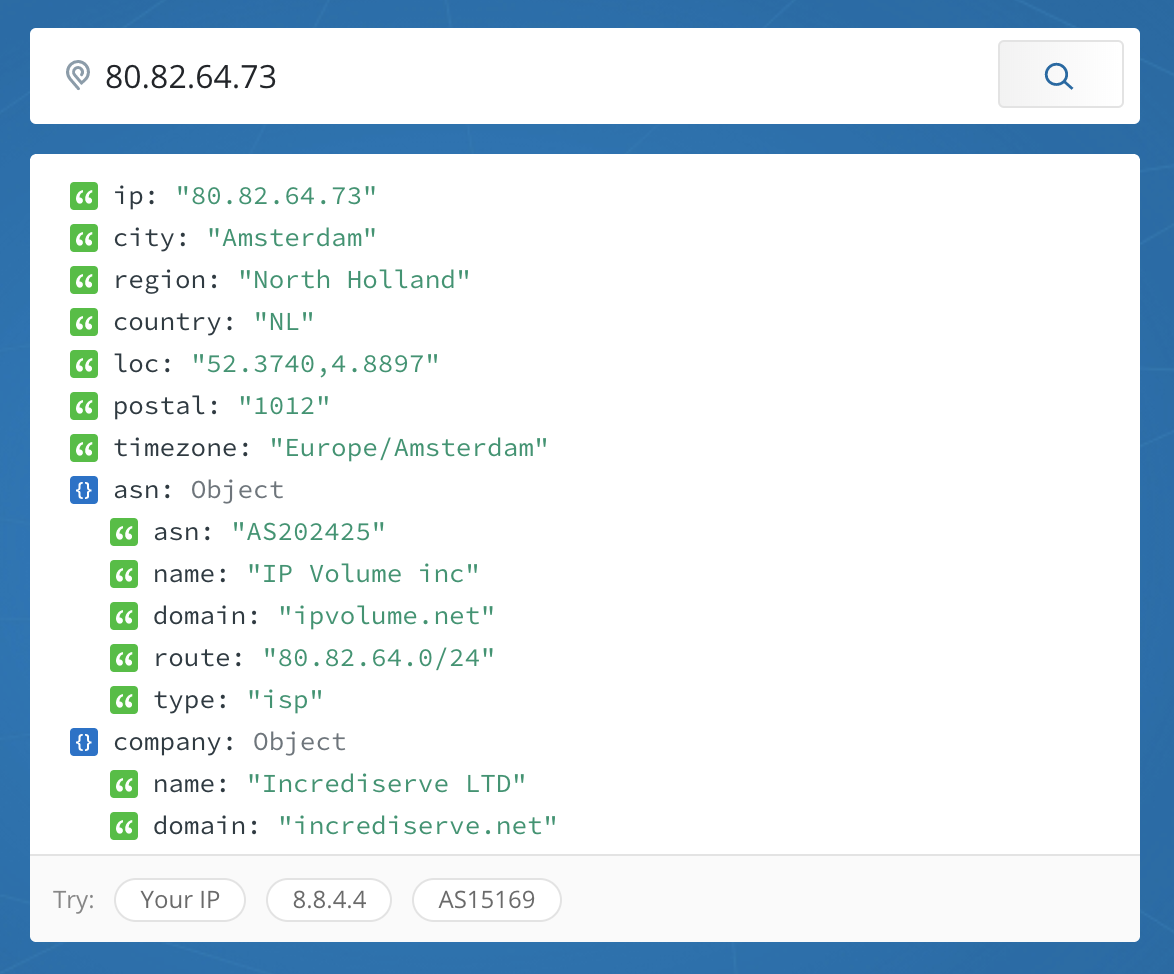
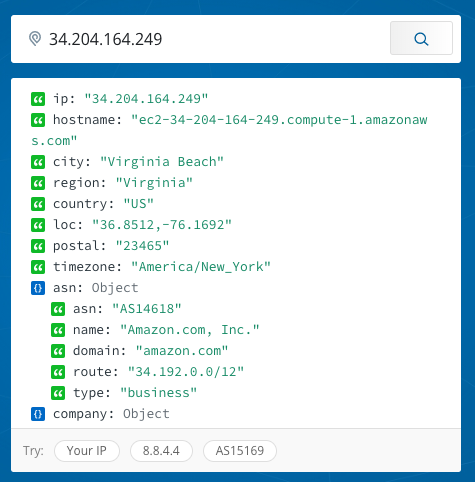
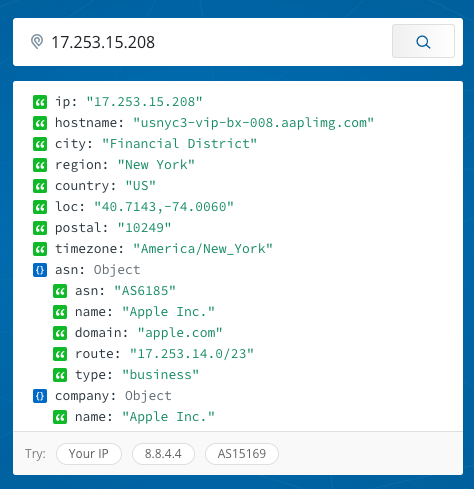
When I looked at the source IP addresses of the machines, the following locations came up:
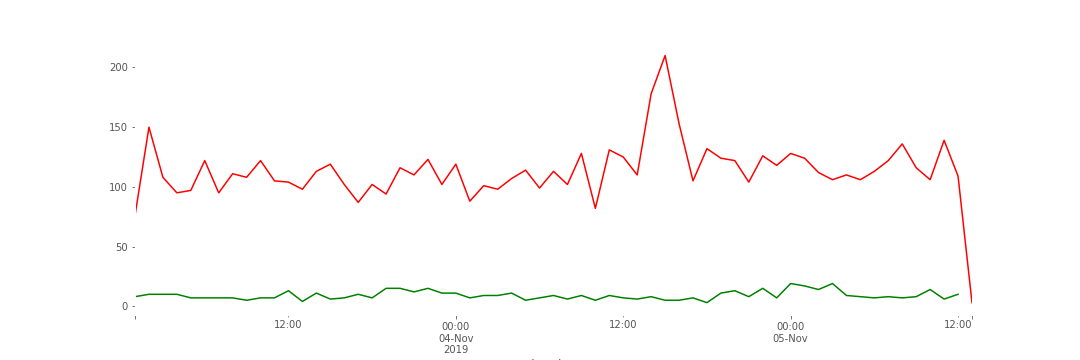
I also examined the results to see which protocols were most used. The following chart shows hourly hits, with TCP represented in red and UDP represented in green.
I also looked at which of my ports were being hit the most often. A few interesting ones:
- 1433: Typically associated with Microsoft SQL Servers. Known worms have used this port. (Source.)
- 60001: A few known trojans use this port. (Source.)
- 22: ssh!
- 3389 Sometimes used for Windows Remote Desktop services (Source.)
- 5060: A port usually used for VoIP or SIP (Session Initiation Protocol) (Source).
- 8545: The standard for for some Ethereum mining equipment. (Source)
- 6379: Post usually used for Redis servers. (Source).
For my packet sniffing assignment, I ran Wireshark over a number of occasions to understand what kind of information was available to someone sitting on my network, who was talking to whom, etc. The collection instances are noted below:
- 30 minute period when I was web browsing
- ~7 minutes while I watched TV, and alternately played games on my Switch and browsed on my phone (I don’t usually try to do so many things as once, but thought it would be an interesting set of actions for this assignment.)
- A capture of a minute or two while I visited
https://www.nytimes.com, https://www.amazon.com, and http://neverssl.com/online using the Tor Browser.
- Same as above, but this time using Google Chrome.
I had exported each of these sessions as CSVs to analyze further using python-based tools, and also kept the capture session so that I could investigate particular packets more closely. I’ve reported some of topline highlights from each of these sessions below:
1. General Web Browsing
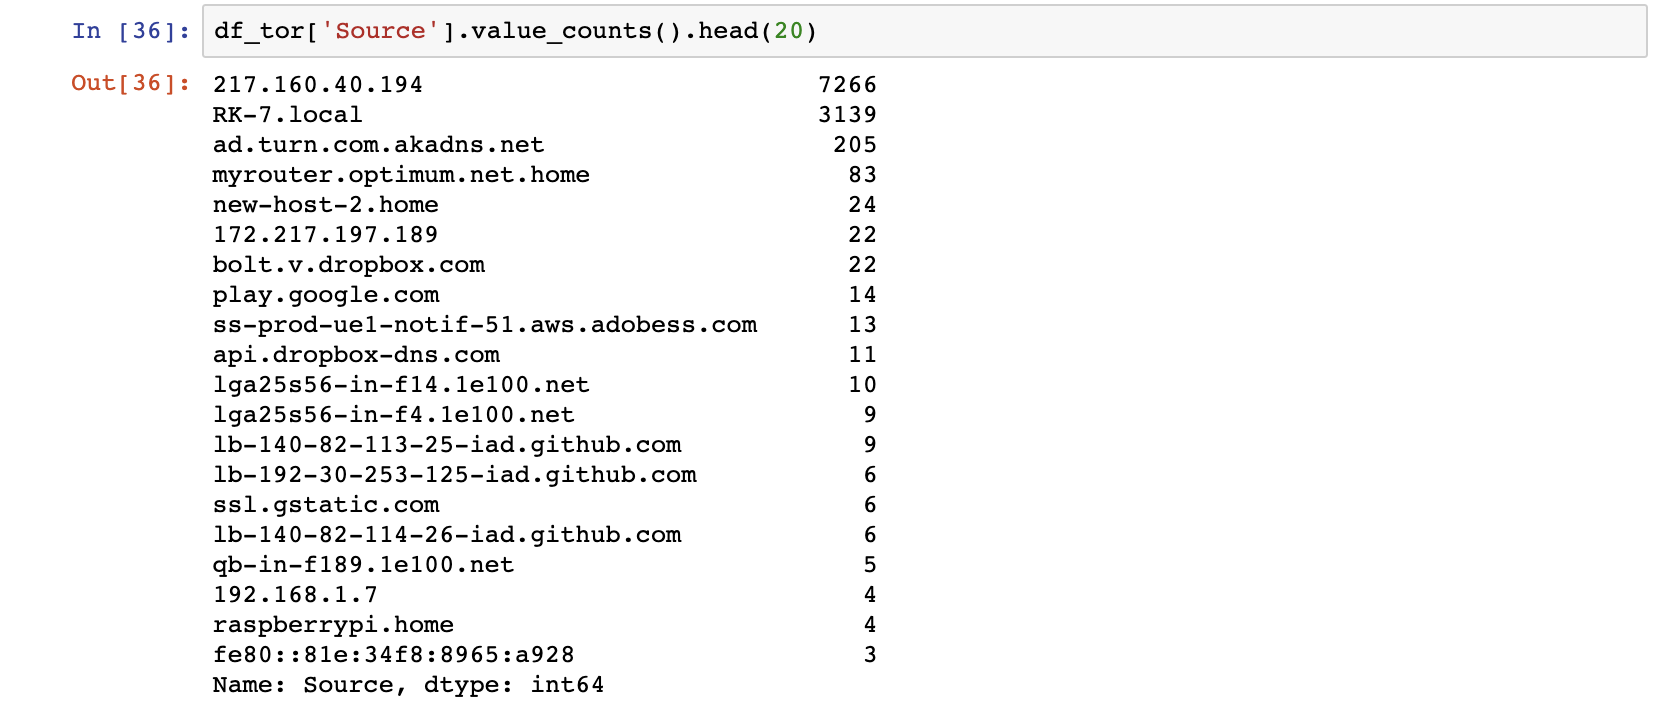
When I examined some of the most frequently appearing destinations, quite a few of the usual suspects showed up:
(I used IPInfo.io until I remember I could just resovle some of these addresses within Wireshark.)
An unexpected destination popped up in my packet sniffing:
Woopra seems to be a service for collecting and analyzing customer journey analytics, and as you might suspect, this was not a website that I was visiting myself by going to woopra.com, but rather, what was visited on my behalf by some site or service I was using.
Another interesting tidbit that came out of my investigation of destinations was that the names of the slack teams I visited appeared in plaintext.

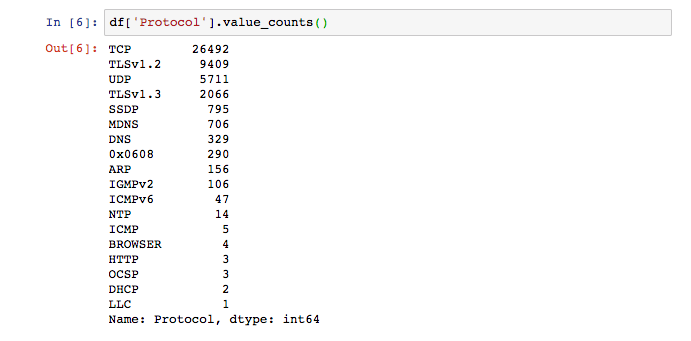
Besides looking at destinations, I also looked at what kinds of protocols were in use across my network:
This particular protocol was unfamiliar to me:
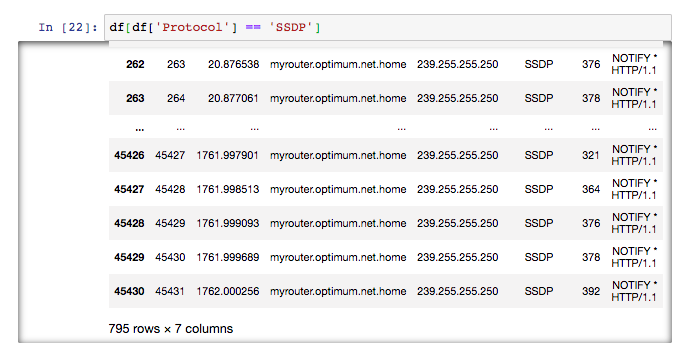
According to my research, SSDP stands for simple service discovery protocol, and can be used for advertisement and “presence” discovery, without the use of DHCP or DNS. The protocol uses UDP packets over port 1900, and devices use it to be easily discoverable to each other. Cloudflare, which had experienced a botnet attack over this protocol has a nice write-up about both the attack and SSDP.
In my case, it seemed that the source of my SSNP traffic was my router which was sending packets to 239.255.255.250. This conversation on DLS Reports seemed to suggest that my router was in multicast mode, and 239.255.255.250 is reserved by IANA for special purposes.
2. All the Entertainment Devices
This was a less exciting analysis than I had hoped. I was streaming from my Roku, and while you could see what I was using my Roku, you could not see what I was watching or even what video services I was using. Good for privacy, but less thrilling than Surya’s smart home adventures.
3. & 4. Browsing with and without Tor
Jackie and I attended a workshop about Tor by the Tech Learning Collective this weekend, and it inspired me to check out my packets while surfing the web on Tor. I only visited three new sites while packet sniffing: https://www.nytimes.com, https://www.amazon.com, and http://neverssl.com/online. I wanted to see if I could see that my traffic was in fact hidden when using Tor.
My browsing experience was immediately noticeably different when using Tor in the following way:
This was very visible in my Wireshark packet analysis. The most commonly appearing source was an IP address in Berlin:
I did not take note of my Tor “circuit” at the time, but my guess is that this was my entry node into the Tor network. The prevalence of this IP address in my analysis reveals that ways in which your use of Tor would be visible to someone on your network or your ISP, but also that it does a fairly good job of hiding what websites I was visiting.
In comparison, my non-Tor-ified visits to the same websites were very visible in my packet analysis:
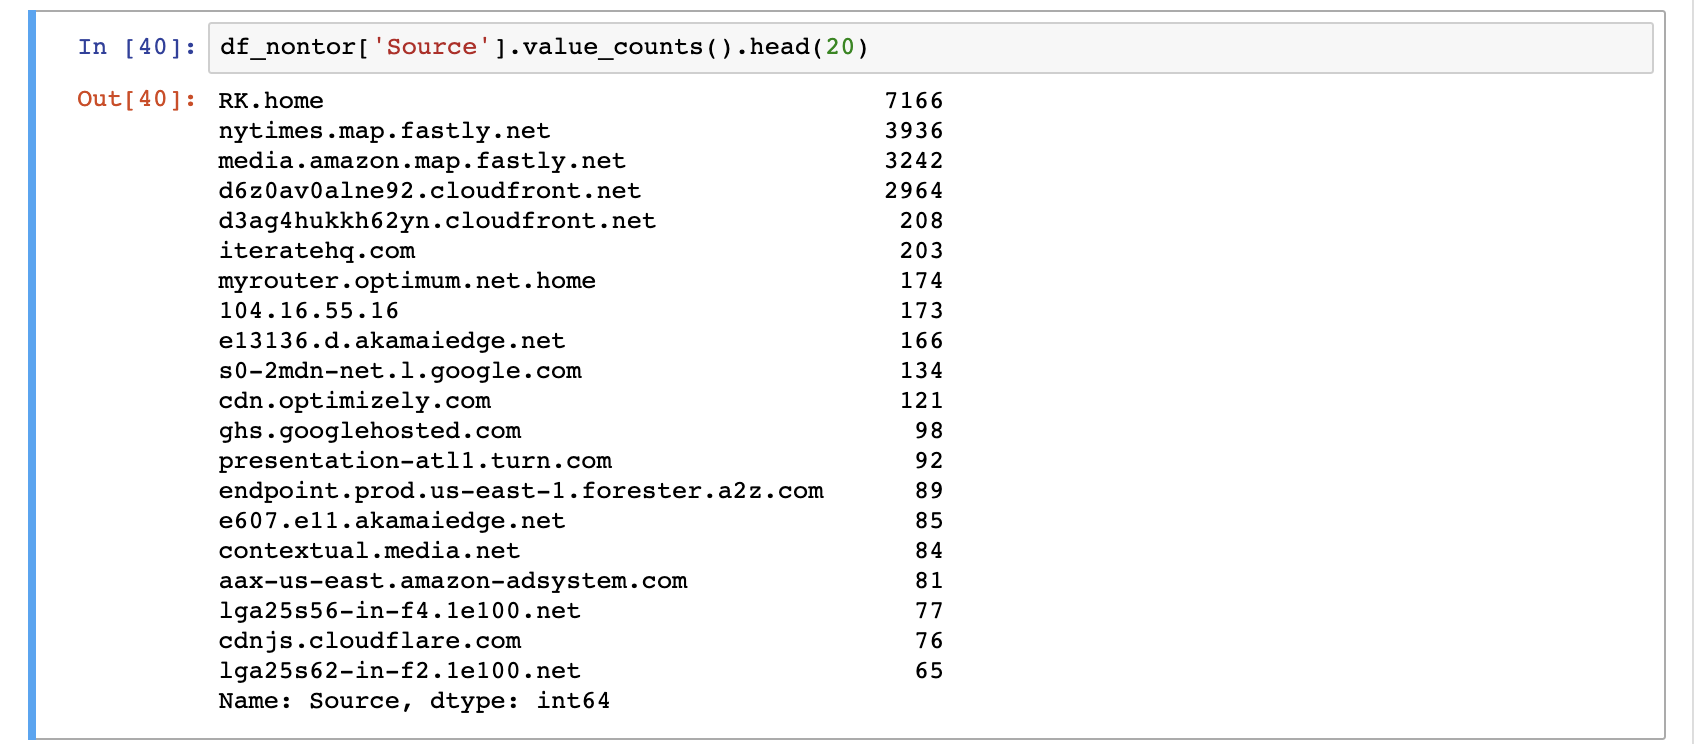
A quick look at my frames from this capture sessions reveals all the sites I visited.
Helpful actions in Wireshark
- Filter by keyword:
frame contains keyword (keyword should be some content you are interested in)
- Analyze > Follow UDP/TCP/HTTP stream
Helpful Resources
For my futurist dish, I hoped to create an edible representation of all that we stand to lose as our climate shifts. These are a few of my notes and sketches about the project:
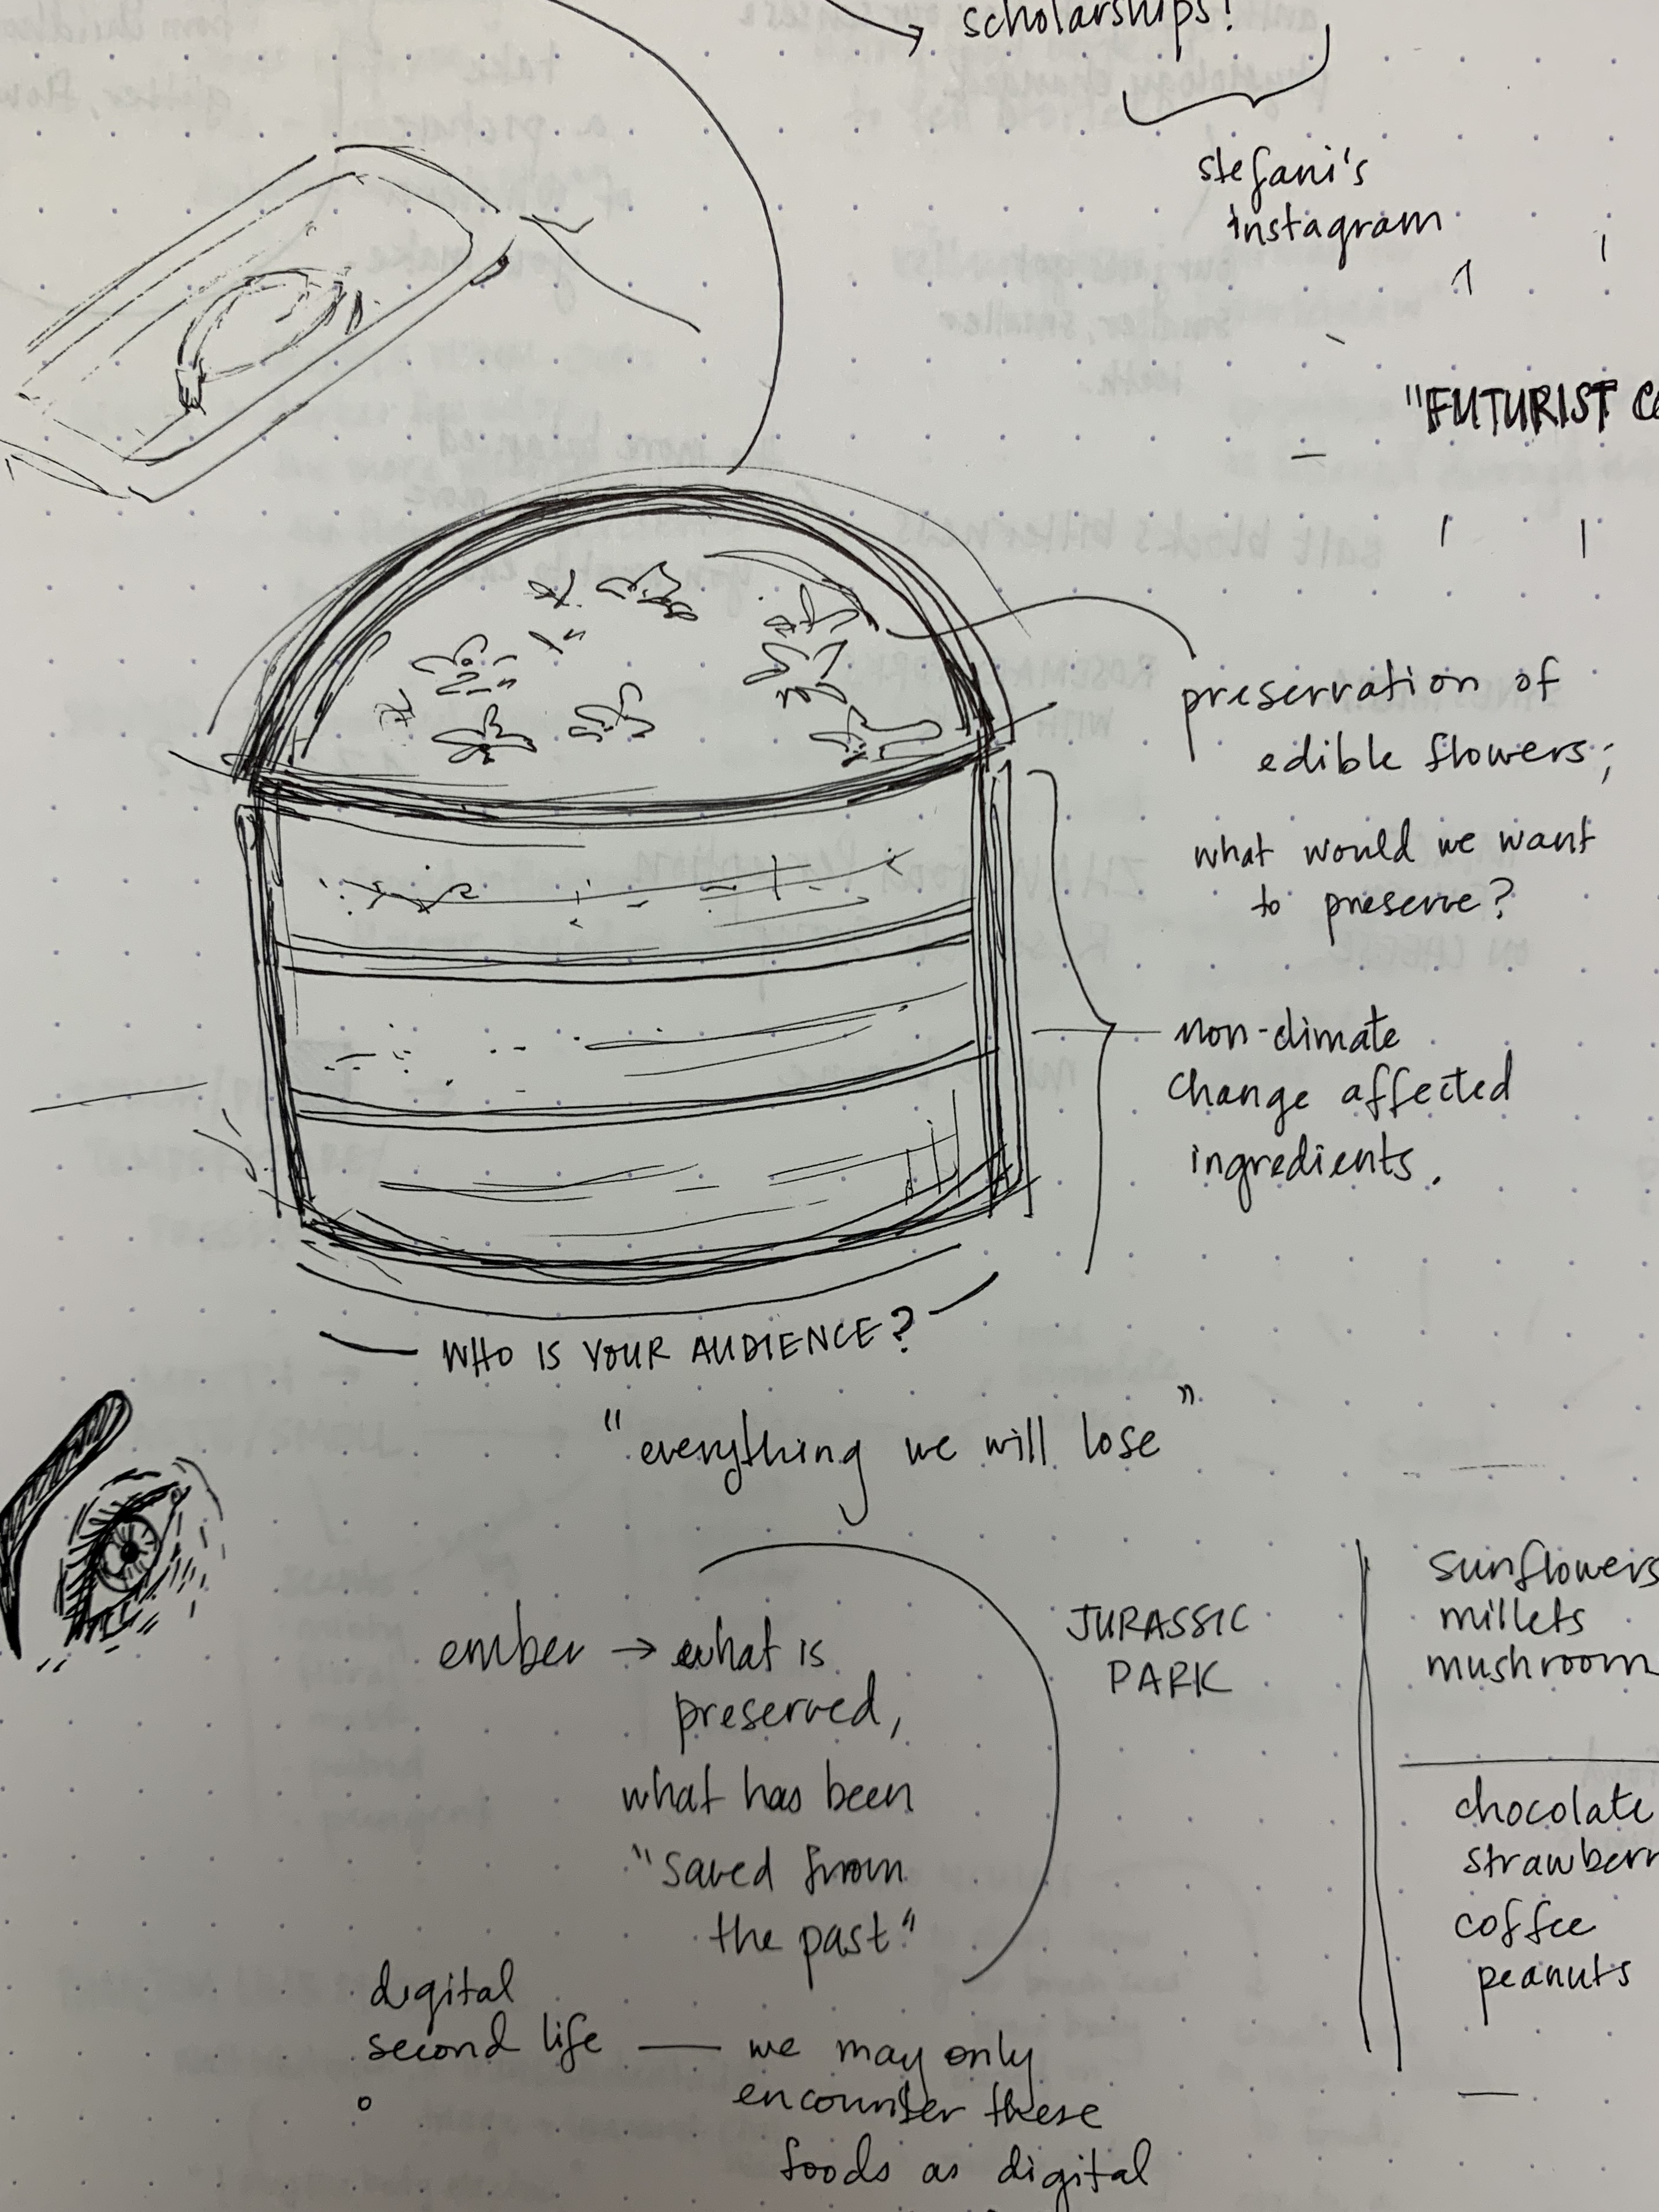
I thought using a “raindrop cake” for the topping of the greater cake would be effective, because it has the effect of making any submerged foods look like they’re preserved (as though they are surrounded by glass). It somewhat reminds me of a pressed flower ring I once had. I hoped to place foods (such as strawberries, flowers, etc.) that are and would be affected by climate change.
I found a pretty nice recipe for the raindrop cake using agar, an ingredient we had been introduced to in class.
Here was my first attempt at the dish:

This was quite close to the look I was going for, but not exactly right: it was cloudier than I hoped, the fruits did not sink to the bottom of my mold, and the texture was a bit stiffer than a proper raindrop cake should be. It also did not taste yummy – too bland and the mint overpowered most of the other flavors.
I made a few adjustments to the my recipe, and added my (box-mix) cake to to the dish.
This was next stage of this dish:
As my initial sketch (just barely) hints: I wanted to implement an augmented reality overlay to this project, but translucent 3D objects are REALLY hard to make into object targets. I do want to keep working on this as a potential component of a futurist dish, as I would argue that the digital has already become a part of how we experience our food (and our pleasures around food).
Other resources
This is an overly complicated and inaccurate clock (though perhaps, quite systematic in its inaccuracies).
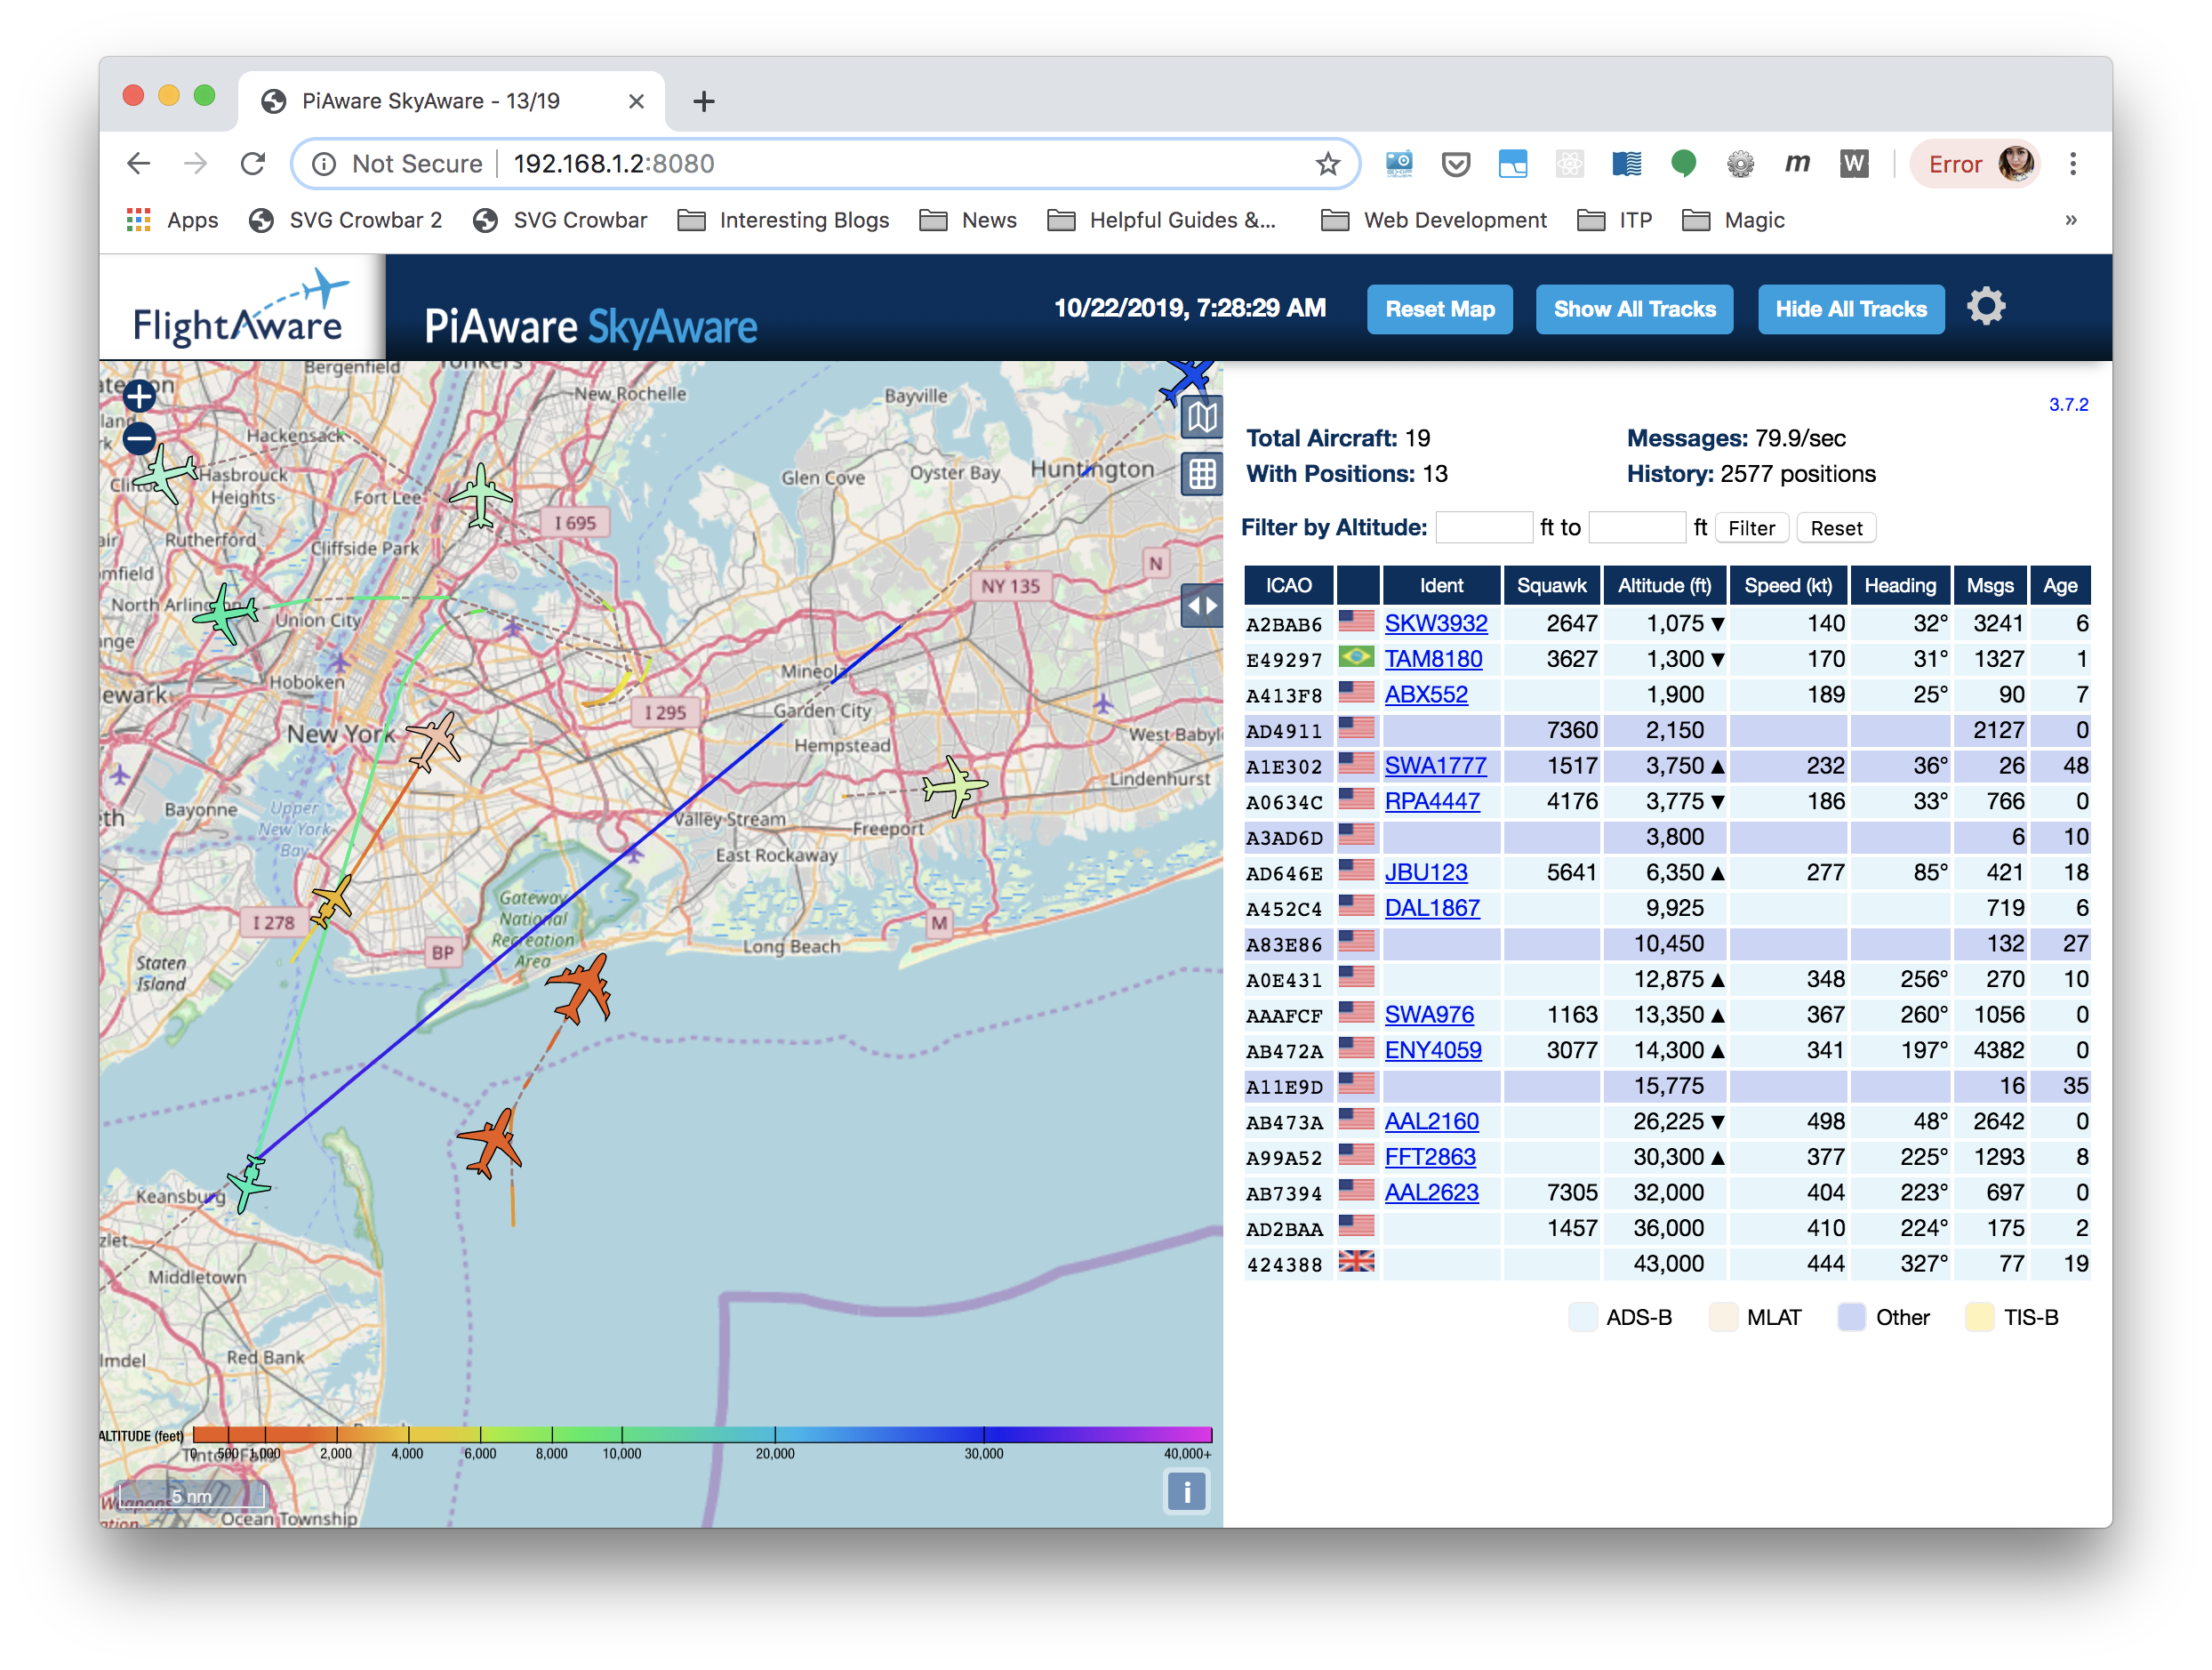
I wanted to play with the history of how our time, especially across great expanses of land, became standardized. To understand when a train was due to arrive, it had become historically important to have a shared notion of what time it was. In this project, I treat a mode of transportation as a literal arbiter of truth on the question of time. I look at planes that detectable from my apartment, and then check to see if they are running late, early, or on time. I then offset my clock based on the time as kept by the average of the planes above me.
In order to take on this wild and perhaps unnecessary endeavor, I installed dump1090 (a driver for software-defined radio projects) onto a Raspberry Pi hooked up to nifty SDR antenna dongle.


Dump1090 (or technically, it’s current version dump1090-fa), is quite helpful and provides users with a nice little map and quite a bit of data of all of the planes it is able to sense.
Initially, I attempted to use their identifier codes to them programmatically scrape flightaware.com to get information about how delayed (or not) each plane was. But unfortunately, FlightAware, as their business model relies on their ability to sell this data, makes it quite difficult to do (without signing up on their site). So, like a post-naturalist observer, who perhaps watches planes instead of birds, I searched the databases (ah, my digital field guide) myself to identify the planes I saw.
I saved the data here.
Absurd.
Here is the final clock that resulted from these endeavors.